Signal Processing Software
Signal Processing Software
In the field of industrial level measurement, the accuracy of a sensor is only as reliable as its ability to interpret raw data. While the physical hardware—the antennae of a radar level meter or the transducer of an ultrasonic sensor—is responsible for emitting and receiving signals, the signal processing software embedded within the transmitter determines the quality of the final measurement. This software acts as the computational bridge between raw electrical pulses and actionable process data, filtering out environmental noise and identifying the true level of the medium amidst complex tank geometries.
For engineers and system integrators, understanding the logic behind signal processing is essential for selecting the right instrumentation. Advanced software algorithms allow modern level meters to operate in challenging conditions, such as those involving heavy agitation, steam, or internal obstructions like heating coils and ladders. By leveraging sophisticated signal processing software, industrial facilities can achieve high precision and long-term stability in their automation processes.
The Role of Signal Processing Software in Level Measurement
Modern industrial level transmitters, particularly non-contact technologies like radar and ultrasonic, rely on Time-of-Flight (ToF) principles. The device emits a pulse or a continuous wave, which travels through the headspace of a vessel, reflects off the surface of the material, and returns to the sensor. However, the return signal (or echo) is rarely a clean, solitary peak. It is often accompanied by "noise"—reflections from the vessel walls, internal structures, and even the turbulence of the liquid itself.
Signal processing software is tasked with several critical functions:
1. Echo Identification: Distinguishing the reflection of the product surface from false echoes caused by internal tank obstructions.
2. Noise Suppression: Filtering out high-frequency interference or electrical noise that could jitter the measurement.
3. Signal Amplification: Enhancing weak signals returned from low-dielectric materials or surfaces with poor reflectivity.
4. Data Linearization: Converting a distance measurement (e.g., 5.2 meters from the sensor) into a volume measurement (e.g., 12,400 liters) based on the specific geometry of the tank.
For a comprehensive overview of hardware and integrated software options available for industrial use, engineers should visit the Main Page of the manufacturer’s technical catalog to review specific product capabilities.
Core Measurement Principles and Signal Conversion
Before exploring software logic, it is necessary to understand the physics of the signals being processed. Most non-contact level meters use one of two primary methods for signal generation and reception.
Pulse Time-of-Flight
In pulse-based systems, the transmitter sends a short burst of energy. The software starts a high-speed timer the moment the pulse is sent and stops it when the echo is received. Because the speed of light (for radar) or the speed of sound (for ultrasonic) is known, the distance is calculated as:
\[ Distance = \frac{Speed \times Time}{2} \]
The software must account for variables that affect speed. For instance, in ultrasonic measurement, the speed of sound varies significantly with temperature. Therefore, the signal processing software must integrate data from a temperature sensor to apply a compensation factor in real-time.
FMCW (Frequency Modulated Continuous Wave)
High-end radar level meters often use FMCW technology. Instead of a pulse, the device emits a continuous signal with a frequency that changes linearly over time (a "sweep"). The signal processing software compares the frequency of the emitted signal with the frequency of the reflected signal. The frequency difference is directly proportional to the distance. This method requires complex Fast Fourier Transform (FFT) algorithms within the software to convert frequency-domain data into distance-domain data, offering much higher resolution than pulse-based systems.
Advanced Filtering and Noise Reduction Techniques
The efficacy of signal processing software is most evident in "dirty" applications. To maintain a stable reading, the software employs several layers of digital filtering.
False Echo Suppression (Echo Mapping)
One of the most important features of modern software is the ability to create a "map" of the empty tank. During commissioning, the software records all reflections from static objects like agitator blades, support beams, and inlet pipes. These are stored as a "false echo curve." During normal operation, the software subtracts this map from the live signal, ensuring that it only tracks the peak that moves—the product surface.
Damping and Smoothing
In tanks with heavy surface turbulence or boiling liquids, the raw distance reading may fluctuate rapidly. Signal processing software applies damping (a time-constant filter) to smooth out these fluctuations. If a damping value of 10 seconds is set, the output will represent a weighted average over that period, preventing the control system from reacting to momentary splashes.
Threshold Tracking
Software uses a dynamic threshold to identify the echo. If the signal strength drops (perhaps due to foam or dust), the software can automatically lower the sensitivity threshold to maintain a lock on the surface, provided the signal-to-noise ratio remains within acceptable limits.
Practical Selection Criteria for Industrial Applications
When evaluating level measurement solutions, the sophistication of the internal signal processing software should be a primary consideration. The following table outlines how software requirements differ across various industrial contexts.
| Application Type | Primary Software Challenge | Essential Software Feature |
| :— | :— | :— |
| Chemical Storage | Corrosive vapors affecting signal strength | Automatic Gain Control (AGC) |
| Wastewater Sumps | Surface foam and condensation on sensor | Multi-echo tracking & False echo mapping |
| Bulk Solids (Grains/Cement) | Uneven surfaces and heavy dust | FFT-based noise filtering & signal averaging |
| High-Speed Filling | Rapidly changing levels | High update rate & low damping lag |
| Non-Linear Tanks | Complex volume calculations | Custom strapping tables (Linearization) |
Installation and Software Configuration Considerations
Successful deployment of level instruments requires more than just physical mounting; it requires proper software configuration. Most manufacturers provide dedicated PC-based software or mobile apps that interface with the device via HART, Modbus, or Bluetooth.
Step 1: Basic Parameter Entry
The user must input the "Tank Height" (the distance from the sensor face to the bottom) and the "Dead Zone" (the minimum distance the sensor can measure, typically 0.1m to 0.5m depending on technology). The signal processing software uses these as the boundaries for its calculations.
Step 2: Echo Curve Analysis
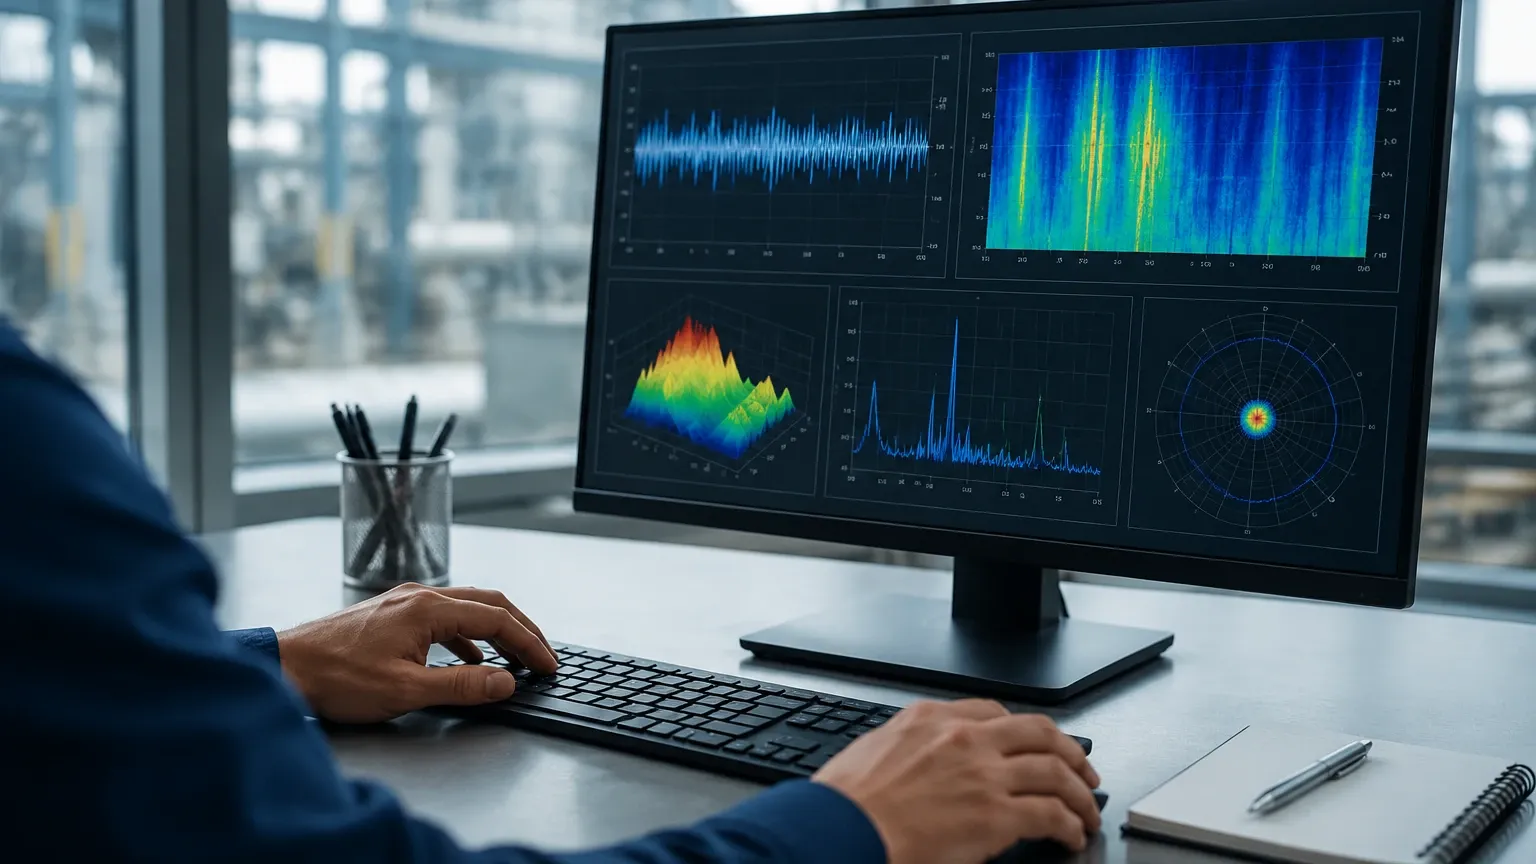
Technicians should view the live echo curve (the visual representation of the signal). If the software is picking up a reflection from a weld seam or a ladder, the technician must manually trigger a "false echo suppression" routine to teach the software to ignore that specific distance.
Step 3: Output Scaling
The software must be configured to map the measured range to a 4-20mA signal. For example, 0% (4mA) might be set at a distance of 10 meters (empty), while 100% (20mA) is set at 1 meter (full).
Limitations and Physical Constraints
While signal processing software is powerful, it cannot overcome the fundamental laws of physics. Engineers must be aware of the following limitations:
* Total Signal Loss: If a medium has an extremely low dielectric constant (like some liquefied gases) or if there is extremely dense foam, the signal may be completely absorbed or scattered. No amount of software amplification can process a signal that does not return to the sensor.
* The Dead Zone: Software cannot process signals that return too quickly. In ultrasonic sensors, the transducer must stop vibrating before it can listen for an echo. This creates a physical "blind spot" near the sensor face.
* Processing Latency: Highly complex algorithms, especially in FMCW radar, require a finite amount of time to compute. In extremely fast process loops, the software's update rate (e.g., 1 reading per second) must be matched to the process requirements to avoid lag.
Frequently Asked Questions (FAQs)
Q: Can signal processing software distinguish between liquid and foam?
A: It depends on the foam's density. Dry, light foam often allows radar signals to pass through to the liquid below. Dense, wet foam may reflect the signal. Advanced software can sometimes identify both peaks, allowing the user to select whether they want to measure the top of the foam or the liquid level.
Q: What happens if the software loses the echo?
A: Most industrial transmitters allow the user to define a "fail-safe" state. The software can be programmed to hold the last valid value, drive the output to 22mA (error high), or 3.6mA (error low) to alert the control room.
Q: Is it possible to update the software in the field?
A: Many modern transmitters support firmware updates. This allows manufacturers to deploy improved signal processing algorithms or new communication protocols without requiring the user to replace the physical hardware.
Conclusion
In the modern industrial landscape, the performance of level measurement instrumentation is inextricably linked to the quality of its signal processing software. By effectively managing echo curves, filtering out environmental interference, and providing accurate linearization, this software ensures that process operators have the reliable data needed for safety and efficiency. When selecting a level meter, it is vital to look beyond the physical specifications and consider the diagnostic and processing capabilities of the internal logic. For those seeking high-performance measurement solutions with integrated advanced processing, exploring the Main Page of industry-leading manufacturers provides a starting point for finding the right balance of hardware and software for any application.