Ecograph
Ecograph
In the landscape of industrial automation and process monitoring, the ability to record, visualize, and analyze data in real-time is as critical as the measurement itself. An ecograph, commonly referred to in engineering circles as a paperless recorder or a graphic data manager, serves as the central nervous system for level measurement installations. While sensors like radar or ultrasonic transmitters provide the raw data, the ecograph transforms these electrical signals into actionable insights, ensuring compliance with safety standards and optimizing operational efficiency.
For professionals managing water treatment facilities, chemical processing plants, or oil and gas storage, understanding the integration of an ecograph with level measurement instruments is essential. This guide explores the technical principles, selection criteria, and installation best practices for utilizing these devices in modern industrial environments.
Measurement Principles and Data Acquisition
The fundamental role of an ecograph is the acquisition and visualization of process variables. In level measurement applications, the device does not measure the level itself but rather interprets the signals sent by primary transmitters.
Signal Conversion
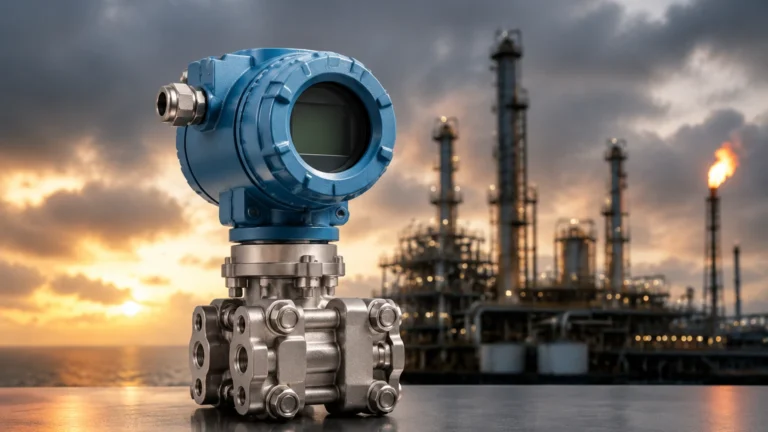
Most industrial level sensors, such as those found on the Main Page of specialized instrument providers, output a standard 4-20 mA analog signal. The ecograph features universal inputs that can accept these analog currents, as well as RTD (Resistance Temperature Detector) or thermocouple signals. The internal circuitry of the recorder converts these analog values into digital data via high-resolution A/D converters.
Visualization and Logging
Once digitized, the data is displayed on a high-resolution TFT screen. Modern units utilize a "paperless" approach, storing data in internal non-volatile memory or on external media like SD cards or USB flash drives. This eliminates the maintenance burden associated with traditional paper-and-ink chart recorders. The ecograph provides various display modes, including digital values, bar graphs, and historical trend curves, allowing operators to spot process deviations instantly.
Integrating Ecograph Units with Level Sensors
To achieve a reliable monitoring system, the ecograph must be correctly paired with the appropriate level measurement technology. The choice of sensor depends on the medium and the environment, while the recorder ensures the data is captured accurately.
1. Radar Level Meters: Used for non-contact measurement in volatile or high-pressure environments. The ecograph captures the 4-20 mA or Modbus signal from the radar unit to track rapid level changes in chemical reactors.
2. Ultrasonic Level Sensors: Ideal for water and wastewater applications. The recorder can be programmed to perform open-channel flow calculations based on the level data provided by the ultrasonic sensor.
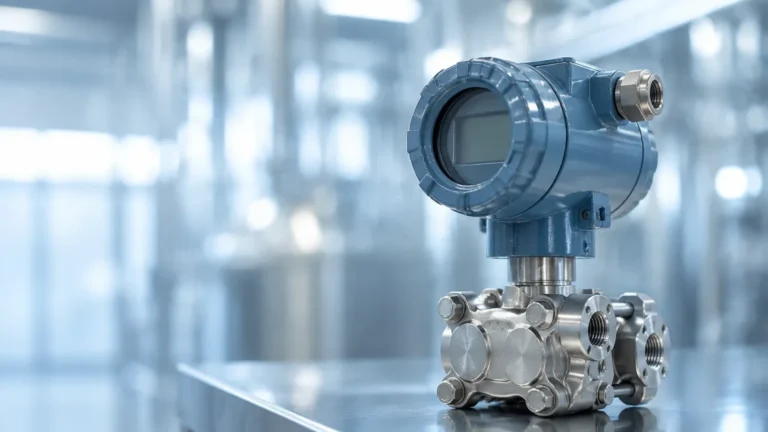
3. Hydrostatic Pressure Transmitters: Common in deep wells and large storage tanks. The ecograph monitors the pressure-to-level conversion, often providing power to the loop-powered sensor through its integrated transmitter power supply.
4. Magnetic Level Gauges: When equipped with a reed chain transmitter, these gauges provide continuous level data to the recorder for remote monitoring of hazardous liquids.
Key Evaluation Criteria for Selection
Selecting the right ecograph requires a thorough assessment of the application's complexity. Engineers should evaluate the following technical specifications:
Channel Capacity and Scalability
Consider the number of measurement points required. Basic units may support 3 to 6 channels, while modular systems can expand to 20 or more. It is advisable to select a unit with 20% spare capacity to accommodate future expansion of the sensor network.
Communication Protocols
In the era of Industry 4.0, connectivity is paramount. Ensure the device supports standard protocols such as:
* Modbus RTU/TCP: For integration with PLCs and SCADA systems.
* Ethernet/IP: For high-speed data transfer across plant networks.
* Web Server Integration: Allowing remote viewing of level data via a standard web browser.
Data Security and Compliance
For industries such as pharmaceuticals or food and beverage, data integrity is a legal requirement. Look for units that comply with FDA 21 CFR Part 11, which ensures that electronic records are as reliable as paper records. This includes audit trails, user management, and electronic signatures.
Technical Selection Table
| Feature | Standard Application | Advanced/Regulated Application |
| :— | :— | :— |
| Input Type | 4-20 mA, 0-10V | Universal (RTD, TC, Pulse, Analog) |
| Display Size | 110 mm (4.3") | 145 mm (5.7") or larger |
| Sampling Rate | 100 ms to 1 s | < 100 ms for high-speed transients |
| Storage Media | Internal Flash / SD Card | Internal Flash / SD Card / USB / FTP Upload |
| Protection Class | IP65 (Front Panel) | IP66 / NEMA 4X (Front Panel) |
| Math Functions | Basic (+, -, *, /) | Advanced (Integration, Flow, Logic) |

Installation and Wiring Considerations
Proper installation is the difference between a reliable system and one prone to signal interference.
Mounting
Most ecograph units are designed for panel mounting. The cutout dimensions must be precise to maintain the IP rating of the control cabinet. Ensure there is sufficient clearance behind the panel (typically 150 mm to 200 mm) for cable management and heat dissipation.
Wiring and Shielding
To prevent electromagnetic interference (EMI) from affecting level readings:
* Use shielded twisted-pair cables for all analog inputs.
* Ground the shields at a single point, usually at the recorder end.
* Separate signal cables from high-voltage power lines by at least 300 mm (approx. 12 inches).
Environmental Protection
While the front panel of an ecograph is usually rated for IP65 or IP66, the rear terminals are often exposed. If the unit is installed in a humid or dusty environment, it should be housed in a secondary NEMA-rated enclosure. Operating temperatures should typically be maintained between -10°C and +50°C.
Limitations and Common Risks
While highly versatile, the ecograph has limitations that must be addressed during the design phase:
* Signal Lag: In very high-speed processes, the sampling rate of the recorder might introduce a slight delay compared to the real-time sensor output. This is rarely an issue for level measurement but critical for pressure surge monitoring.
* Memory Overwrite: If not configured correctly, the device may overwrite historical data once the storage is full. Implementing an automated FTP backup or using high-capacity industrial SD cards is recommended.
* Input Impedance: Ensure the input impedance of the recorder matches the requirements of the level transmitter. Most 4-20 mA inputs have an impedance of 250 ohms; if multiple devices are in the loop, the total load must not exceed the transmitter's capability.
Frequently Asked Questions (FAQs)
Q: Can an ecograph control a pump based on level readings?
A: Yes. Most units are equipped with relay outputs that can be programmed as limit switches. For example, the recorder can trigger a pump-down cycle when the level reaches a high setpoint.
Q: How often does the unit need calibration?
A: While the digital components are stable, it is standard practice to verify the input accuracy annually. This involves using a signal generator to simulate 4 mA and 20 mA inputs and checking the displayed value.
Q: Is it possible to view the data on a smartphone?
A: If the unit is connected to a local network and features a built-in web server, operators can access the live dashboard via any mobile device connected to the same network or through a secure VPN.
Conclusion and Next Steps
The integration of an ecograph into a level measurement system provides the transparency needed to manage complex industrial processes. By acting as a bridge between the physical sensor and the decision-maker, these devices ensure that every millimeter of level change is recorded and accounted for.
When planning a new installation or upgrading an existing facility, engineers should prioritize compatibility between the primary sensors and the data management unit. For a comprehensive overview of compatible radar, ultrasonic, and hydrostatic sensors, professionals should review product options and application support on the Main Page of their preferred instrumentation partner. Confirming the specific communication requirements and environmental constraints early in the project will ensure a seamless and reliable data logging solution.