Dataviewer
Dataviewer
In the landscape of industrial automation and process control, the ability to accurately interpret sensor data is as critical as the measurement itself. A dataviewer, in the context of level measurement, refers to the software interface, digital display unit, or integrated monitoring system that translates raw electronic signals from level sensors into actionable information for engineers and operators. Whether managing bulk solids in a silo or corrosive liquids in a chemical reactor, the dataviewer serves as the primary window into the vessel's internal state.
For professional instrumentation teams, the dataviewer is more than a simple display; it is a diagnostic tool used for configuration, troubleshooting, and historical trend analysis. As industries move toward Industry 4.0, the role of these interfaces has expanded from local readouts to sophisticated digital platforms capable of handling multiple communication protocols such as HART, Modbus, and Profibus. For a comprehensive overview of compatible hardware and software interfaces, you may refer to the Main Page of our technical resource center.
Measurement Principles and Data Visualization
Before selecting or configuring a dataviewer, it is essential to understand the underlying measurement principles of the sensors providing the data. Different technologies produce different types of raw data, which the dataviewer must process appropriately.
Radar Level Measurement (ToF)
Radar level meters operate on the Time of Flight (ToF) principle. The sensor emits high-frequency microwave pulses (typically in the 26 GHz or 80 GHz range) that reflect off the medium's surface. The dataviewer for a radar system often includes an "echo curve" display. This visual representation allows engineers to see the amplitude of the return signal and identify the true level pulse amidst background noise or internal tank obstructions.
Ultrasonic Level Sensors
Similar to radar, ultrasonic sensors use sound waves. The dataviewer calculates the distance based on the time it takes for the sound pulse to return. However, because sound speed is affected by air temperature, the dataviewer must often integrate data from a temperature compensation probe to provide an accurate reading. In these systems, the interface typically displays both the distance to the product and the calculated volume based on tank geometry.
Hydrostatic Level Transmitters
These sensors measure the pressure exerted by a liquid column. The dataviewer converts pressure units (such as bar or kPa) into level units (meters or millimeters). For these applications, the viewer must be calibrated with the specific gravity (density) of the fluid, as changes in density directly affect the pressure-to-level conversion.
The Functionality of a Dataviewer in Level Monitoring
An effective industrial dataviewer provides several layers of functionality that go beyond showing a numerical value. In B2B environments where downtime is costly, these features are indispensable.
1. Real-Time Monitoring: The core function is providing a live feed of the level, often accompanied by a percentage-of-span bar graph. This allows for immediate visual confirmation of tank status.
2. Parameter Configuration: Modern dataviewers allow users to set the Zero and Span points, damping times, and output scaling (e.g., 4-20mA mapping). This eliminates the need for manual calibration at the sensor head in many instances.
3. Diagnostic Echo Curves: For radar and ultrasonic technologies, the dataviewer can plot the signal strength against distance. This is vital for "False Echo Suppression," where the software is instructed to ignore reflections from agitator blades or internal piping.
4. Historical Data Logging: Many dataviewer systems include internal memory or cloud connectivity to log level changes over time. This trend data is used for inventory management and identifying process inefficiencies.
Selection Criteria for Dataviewer Software and Interfaces
When specifying a dataviewer system for industrial applications, engineers must evaluate several technical factors to ensure compatibility and reliability.
| Feature | Requirement | Importance |
| :— | :— | :— |
| Communication Protocol | HART, Modbus RTU, RS485, or 4-20mA | Critical for hardware compatibility. |
| Display Resolution | Minimum 0.1% of span | Necessary for high-precision chemical dosing. |
| Environmental Rating | IP65 to IP67 for local displays | Protects against dust and moisture ingress. |
| Multi-Channel Support | Ability to monitor 1 to 16+ sensors | Reduces cost per point in large tank farms. |
| Power Supply | 24V DC or 110/220V AC | Must match existing site infrastructure. |
Integration with Existing Systems
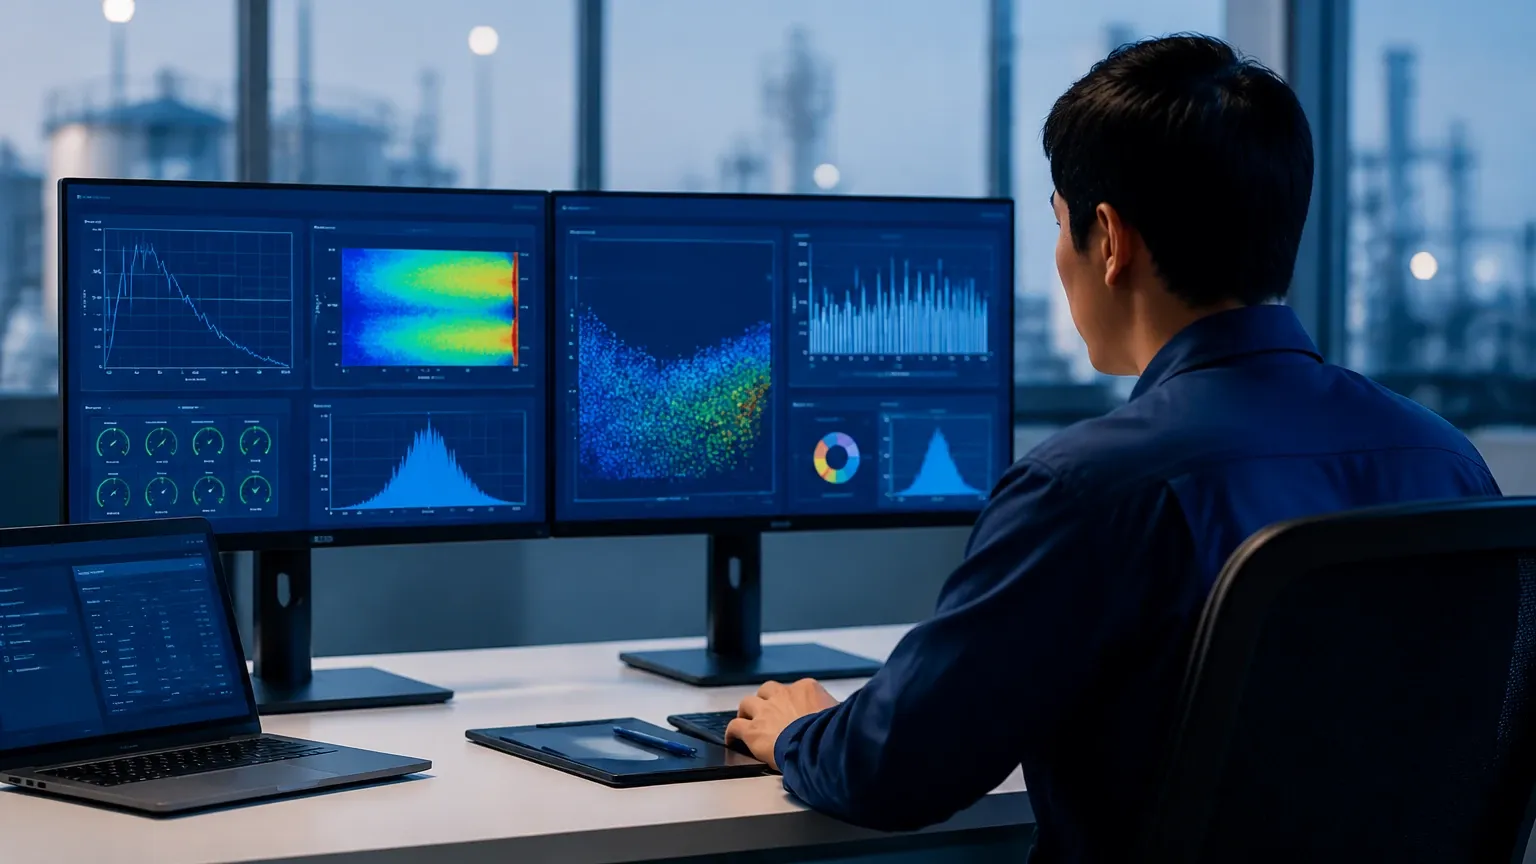
In most B2B scenarios, the dataviewer must integrate with a larger PLC (Programmable Logic Controller) or SCADA system. It is important to confirm whether the dataviewer acts as a standalone master or a transparent gateway. For complex setups involving multiple sensor types, a centralized dataviewer software installed on a control room PC is often the most efficient solution.
Installation and Integration Guidelines
Proper installation of the dataviewer interface is just as important as the sensor mounting. Failure to follow electrical best practices can result in signal noise, which the dataviewer may interpret as fluctuating levels.
* Signal Shielding: Always use shielded twisted-pair cabling for data transmission between the sensor and the dataviewer. The shield should be grounded at one end (usually the control room side) to prevent ground loops.
* Distance Limitations: For RS485/Modbus communication, ensure the total cable length does not exceed 1,200 meters without a repeater. For standard 4-20mA signals, consider the loop resistance to ensure the dataviewer receives a strong enough signal.
* Mounting Location: Local dataviewer displays should be mounted at eye level in an area free from excessive vibration. If the environment is prone to extreme temperatures (below -20°C or above +60°C), an enclosure with heating or cooling elements may be required.
* Software Setup: When using PC-based dataviewer software, ensure the COM port settings (baud rate, parity, stop bits) exactly match the sensor configuration. Most modern systems use a baud rate of 9600 or 19200 for stability over long distances.
Operational Limitations and Troubleshooting
While dataviewers are robust, they are subject to limitations based on the quality of the input signal and the configuration parameters.
Signal Latency
In systems with heavy damping (used to smooth out turbulence in the tank), the dataviewer may show a delay between the actual level change and the displayed value. While this prevents false alarms from splashing, it can be a risk in high-speed filling applications. Operators must balance damping settings within the dataviewer to suit the process speed.
Data Corruption and Noise
Electromagnetic interference (EMI) from large motors or variable frequency drives (VFDs) can corrupt digital data packets. If the dataviewer shows "Comm Error" or erratic jumps in value, check the proximity of signal cables to high-voltage power lines. Using a dataviewer with built-in digital filtering can help mitigate some of these effects.
Scaling Errors
A common risk in dataviewer setup is the mismatch between the sensor's physical range and the software's scaled range. For example, if a radar sensor is capable of measuring 30 meters but the dataviewer is scaled for a 10-meter tank, the 4-20mA signal must be precisely mapped to avoid overflow errors.
Frequently Asked Questions (FAQ)
Q: Can one dataviewer handle both radar and ultrasonic sensors simultaneously?
A: Yes, provided the dataviewer supports multiple channels and the communication protocols (such as Modbus) are compatible. Many centralized dataviewer units are designed to aggregate data from various sensor technologies.
Q: What is the difference between a local display and a dataviewer software?
A: A local display is a hardware unit mounted near the tank for immediate reading. Dataviewer software is typically a PC-based application that offers more advanced features like data logging, remote configuration, and complex diagnostic tools.
Q: Does the dataviewer require periodic calibration?
A: The dataviewer itself usually does not require calibration, but the *link* between the sensor and the viewer does. It is recommended to verify the displayed value against a manual dip-tape measurement at least once a year to ensure the scaling remains accurate.
Q: How do I handle a "No Signal" error on the dataviewer?
A: First, check the power supply to the sensor. Second, inspect the wiring for breaks or loose terminals. Third, verify that the communication address in the dataviewer software matches the address assigned to the sensor hardware.
For engineers looking to optimize their level measurement systems, selecting the right dataviewer is a critical step in ensuring data integrity and process safety. By understanding the relationship between sensor physics and digital visualization, facilities can achieve higher precision and reduced maintenance costs.