Online Turbidity Meter
Online Turbidity Meter
In industrial process control and environmental monitoring, the clarity of a liquid is often as critical as its level or flow rate. An online turbidity meter is a precision instrument designed to provide continuous, real-time measurement of the suspended solids or particulate matter within a fluid. Unlike laboratory analysis, which provides a snapshot in time, online systems allow for immediate response to process upsets, ensuring water quality compliance and protecting downstream equipment.
Turbidity is an optical characteristic of an aqueous sample that causes light to be scattered and absorbed rather than transmitted in straight lines through the sample. In B2B environments—ranging from municipal water treatment to chemical processing and food production—understanding the underlying physics of these measurements is essential for selecting the correct instrumentation.
Measurement Principles of Online Turbidity Meters
Before selecting an instrument, engineers must understand the different optical geometries used to quantify turbidity. The choice of principle depends largely on the expected concentration of particles and the regulatory standards governing the application.
Nephelometry (90° Scatter)
Nephelometry is the most common method for measuring low-to-medium turbidity. It involves directing a light beam into the sample and measuring the light scattered at a 90-degree angle to the incident beam. This method is highly sensitive to small particles and is the standard for drinking water applications.
* ISO 7027 Standard: Utilizes an infrared light source (typically 860 nm) to minimize the interference caused by the color of the liquid.
* EPA 180.1 Standard: Utilizes a tungsten lamp (white light), which is more sensitive to very small particles but can be affected by sample color.
Transmission (Attenuation)
In this method, the sensor measures the decrease in light intensity as it passes directly through the sample to a detector located at 180 degrees. As the concentration of suspended solids increases, more light is absorbed or scattered, reducing the intensity reaching the detector. This principle is generally applied to high-turbidity processes or sludge density monitoring.
Backscatter
Backscatter sensors measure light reflected at an angle greater than 90 degrees (often 135 or 180 degrees). This technology is particularly effective for very high concentrations of suspended solids, such as those found in industrial wastewater or chemical slurries, where the liquid is too opaque for light to penetrate deeply.
Ratio Technology
Advanced online turbidity meters often use a "ratio" of multiple detectors (e.g., 90-degree scatter, transmitted light, and forward scatter). This mathematical approach compensates for fluctuations in light source intensity, optical fouling, and the presence of color, providing a more stable and accurate reading over a wider range.
Key Components of an Online System
A complete online turbidity measurement loop typically consists of four primary components:
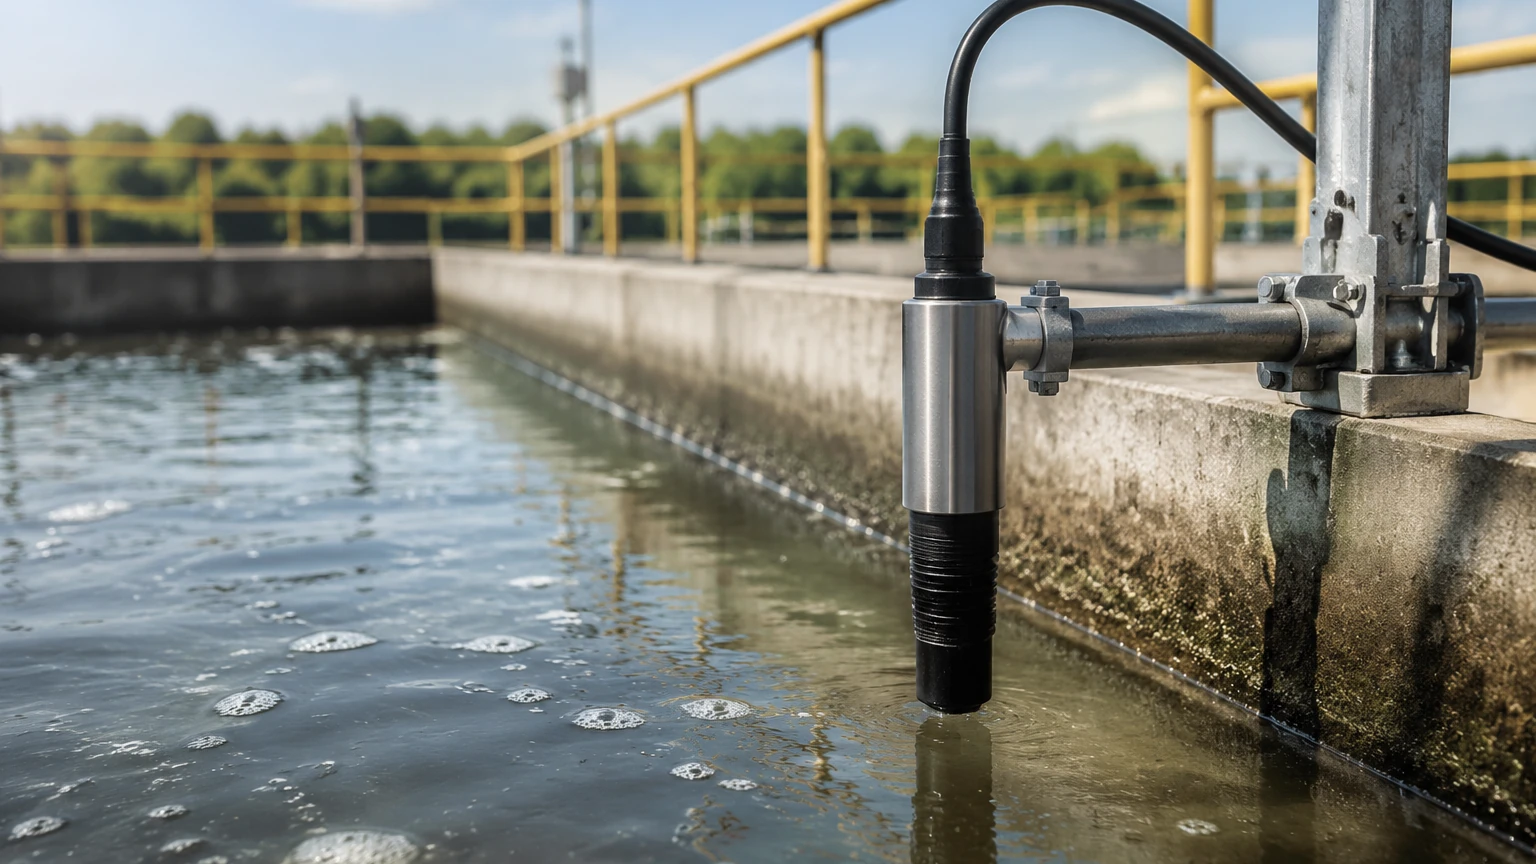
1. The Sensor (Probe): The optical assembly containing the light source and detectors. These can be immersion-style probes for open channels or flow-through cells for pressurized pipes.
2. The Transmitter (Controller): The electronic unit that processes signals from the sensor, displays the turbidity value (usually in NTU, FNU, or mg/L), and provides outputs like 4-20mA or Modbus for integration into a PLC or SCADA system.
3. The Flow Cell/Sampling Hardware: For bypass installations, a flow cell ensures the sample passes the sensor at a controlled velocity and prevents ambient light from interfering with the measurement.
4. Cleaning Systems: Many industrial environments require automated cleaning, such as mechanical wipers or ultrasonic cleaning, to prevent the buildup of biofilm or scale on the optical lenses.
Selection Criteria for Industrial Applications
Choosing the right online turbidity meter requires a thorough evaluation of the process environment. Engineers should consult the Main Page of instrumentation providers to verify compatibility with specific chemical profiles and pressure ratings.
1. Measurement Range
Define the expected minimum and maximum turbidity levels. A sensor optimized for 0–10 NTU (drinking water) will not function correctly in a process with 1,000 NTU (wastewater).
2. Process Temperature and Pressure
Standard sensors are often rated for temperatures up to 50°C (122°F) and moderate pressures. For high-temperature chemical processes or high-pressure boiler feed water, specialized housings and seals are required.
3. Chemical Compatibility
The wetted materials of the sensor—such as PVC, Stainless Steel (316L), or Titanium—must be resistant to the process fluid. This is particularly important in chemical dosing or industrial effluent monitoring.
4. Light Source Selection
* Infrared (LED): Best for colored liquids and meeting ISO 7027 standards.
* White Light (Tungsten): Preferred for compliance with US EPA 180.1 and for detecting extremely fine particles.
Installation Considerations and Best Practices
Proper installation is as critical as the sensor technology itself. Even the most accurate online turbidity meter will provide false readings if installed in a location prone to air bubbles or high turbulence.
Bubble Management
Air bubbles are the primary enemy of turbidity measurement. Because bubbles scatter light similarly to solid particles, they cause significant positive interference (falsely high readings).
* De-bubblers: In bypass systems, a de-bubbler or "bubble trap" should be installed before the flow cell to allow air to escape.
* Pressure Maintenance: Keeping the sample under slight pressure can help keep gas in solution.
Orientation and Flow
* Vertical Upward Flow: In pipe installations, it is best to install the sensor in a vertical section with upward flow. This ensures the pipe remains full and prevents the accumulation of sediment at the bottom or air at the top.
* Flow Rate: Ensure the flow rate is within the manufacturer's specified range. Too slow, and solids may settle; too fast, and cavitation (bubbles) may occur.
Ambient Light Shielding
Optical sensors must be shielded from sunlight or strong artificial light. Most flow cells are opaque for this reason, but immersion sensors in open tanks may require a shading hood.
Technical Comparison Table
| Feature | Nephelometric (90°) | Transmission (180°) | Backscatter (>90°) |
| :— | :— | :— | :— |
| Primary Application | Drinking water, Filter monitoring | High solids, Sludge density | Industrial slurries, Effluent |
| Measurement Range | Low (0–100 NTU) | Medium to High | Very High (up to 100 g/L) |
| Sensitivity | Very High | Moderate | Low |
| Interference Risk | High (bubbles/color) | Moderate (color) | Low (color) |
| Standard Compliance | ISO 7027 / EPA 180.1 | N/A | N/A |
Common Risks and Limitations
While online turbidity meters are robust, they are subject to several operational risks that must be managed through proactive engineering:
* Optical Fouling: The accumulation of algae, minerals (scaling), or oil on the sensor window is the most common cause of measurement drift. Automated cleaning cycles are highly recommended for B2B applications to reduce manual maintenance hours.
* Color Interference: If using a white light source, the color of the liquid (e.g., humic acids in raw water) will absorb light, leading to falsely low turbidity readings. Infrared sources or ratio-based systems mitigate this.
* Particle Size and Shape: Turbidity is an optical measurement, not a direct mass measurement. Two samples with the same mass of solids but different particle sizes will produce different NTU values. Calibration to the specific process medium is often necessary for accuracy in mg/L.
* Calibration Drift: Electronic components and light sources age over time. Regular verification against a secondary standard (like Formazin or stabilized Formazin) is required to maintain accuracy.
Maintenance and Calibration Protocols
To ensure the longevity and reliability of an online turbidity meter, a structured maintenance schedule should be implemented:
1. Weekly Visual Inspection: Check for leaks in the flow cell and ensure the transmitter shows no error codes.
2. Monthly Cleaning: Manually clean the optical windows with a soft cloth and a mild detergent if an automated wiper is not present.
3. Quarterly Verification: Compare the online reading with a calibrated portable or laboratory turbidimeter. If the deviation exceeds 5-10%, a full calibration is necessary.
4. Annual Service: Replace seals, O-rings, and wiper blades (if applicable). Check the integrity of the light source.
Frequently Asked Questions (FAQs)
Q: Can I use a turbidity meter to measure Total Suspended Solids (TSS)?
A: Yes, but only through correlation. You must create a site-specific calibration curve by comparing NTU readings to gravimetric (filter and weigh) laboratory TSS analysis. If the particle characteristics of the process change, the correlation must be updated.
Q: What is the difference between NTU and FNU?
A: NTU (Nephelometric Turbidity Units) is typically used when referring to measurements made with a white light source (EPA 180.1). FNU (Formazin Nephelometric Units) is used for measurements made with an infrared light source (ISO 7027). Numerically, they are often similar but not always identical.
Q: How do I handle high-pressure applications?
A: Standard flow cells are often limited to 0.3–0.6 MPa (approx. 3–6 bar). For higher pressures, you must install the sensor in a bypass line with a pressure-reducing valve or select a specialized high-pressure immersion probe.
Q: Does the online turbidity meter require constant flow?
A: While the sensor can measure static liquid, a constant flow is preferred to ensure the sample is representative of the process and to prevent particles from settling on the sensor optics.
Conclusion
Implementing an online turbidity meter is a strategic investment for any facility focused on process efficiency and regulatory compliance. By understanding the optical principles—whether nephelometric for clean water or backscatter for heavy industrial waste—and accounting for environmental factors like air bubbles and fouling, engineers can ensure reliable data for years to operation. For those integrating these sensors into broader automation systems, reviewing the available interface options and housing specifications on the Main Page is a recommended next step to ensure seamless site integration.