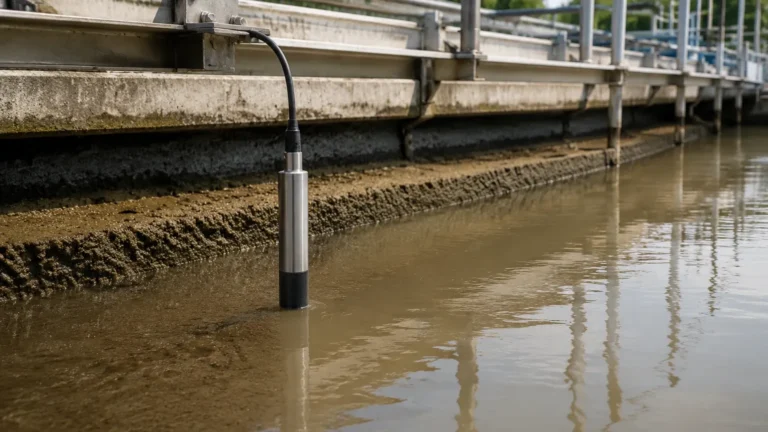
Ysi Turbidity Meter
Ysi Turbidity Meter
Turbidity is a critical parameter in water quality analysis, serving as a primary indicator of the presence of suspended solids, organic matter, and microorganisms. In industrial and environmental monitoring, the YSI turbidity meter has become a standard for both field-based and continuous process applications. Measuring the clarity of a liquid is not merely about aesthetic quality; it is a vital metric for ensuring the efficiency of filtration systems, the safety of drinking water, and the compliance of industrial discharge.
For engineers and technicians, understanding the technical nuances of turbidity measurement—and how these sensors integrate with broader process control systems such as level measurement—is essential for maintaining operational integrity. This guide examines the principles of turbidity measurement, the specific capabilities of YSI instrumentation, and the practical considerations for deployment in various industrial environments.
Measurement Principles: The Science of Light Scattering
Turbidity is defined as the cloudiness or haziness of a fluid caused by individual particles (total suspended solids) that are generally invisible to the naked eye. To quantify this, instruments measure the interaction between light and these particles.
Nephelometry and ISO 7027
Most modern YSI turbidity meters utilize nephelometry, which is the measurement of light scattered at a 90-degree angle from the incident light beam. When a light source (typically an LED) emits a beam into the water sample, particles in the water scatter that light. A detector positioned at 90 degrees records the intensity of the scattered light. The more particles present, the higher the intensity of the scattered light, and thus the higher the turbidity reading.
There are two primary regulatory standards governing this technology:
1. ISO 7027: This international standard specifies the use of an infrared light source (typically 860 nm). Infrared light is preferred for environmental monitoring because it minimizes interference from the natural color of the water (such as humic acids or tannins).
2. EPA 180.1: This standard, primarily used in the United States for drinking water compliance, requires a white light source (tungsten lamp). While highly sensitive to small particles, it is more susceptible to color interference.
Units of Measurement
Turbidity is expressed in various units depending on the technology and standard used:
* NTU (Nephelometric Turbidity Units): The most common unit, typically associated with white light (EPA) sensors.
* FNU (Formazin Nephelometric Units): Used when the instrument conforms to the ISO 7027 infrared standard.
* FTU (Formazin Turbidity Units): A general unit based on Formazin calibration standards.
Technical Overview of YSI Turbidity Sensors
YSI offers turbidity measurement solutions through several platforms, ranging from handheld spot-checking devices to advanced multi-parameter sondes for long-term submersion.
Handheld and Portable Systems
The YSI ProDSS (Digital Sampling System) is a frequent choice for field technicians. It utilizes a digital turbidity sensor that can be used alongside other parameters like pH, dissolved oxygen, and conductivity. The portability of these systems allows for rapid assessment of multiple points across a facility or watershed. These sensors are typically rated for depths up to 100 meters, making them versatile for deep-well or reservoir monitoring.
Continuous Monitoring: The EXO Series
For B2B applications requiring long-term, unattended data collection, the EXO series of multi-parameter sondes is the industry benchmark. A defining feature of the EXO turbidity sensor is the integrated "wiper" system. In underwater environments, biofouling—the accumulation of algae, barnacles, or biofilm on the sensor lens—can lead to significant measurement drift. The automated central wiper mechanically cleans the optical window before each measurement, ensuring data accuracy for months without manual intervention.
Selection Criteria for Industrial Applications
Choosing the right turbidity meter requires a thorough evaluation of the process environment. The following table provides a comparison of key specifications for common YSI configurations used in industrial settings.
Technical Comparison Table
| Feature | ProDSS Handheld | EXO1/EXO2 Sonde | Online Process Sensor |
| :— | :— | :— | :— |
| Measurement Range | 0 to 4000 FNU | 0 to 4000 FNU | 0 to 1000 NTU |
| Accuracy | ±2% or 0.3 FNU | ±2% or 0.3 FNU | ±5% of reading |
| Light Source | 860 nm (Infrared) | 860 nm (Infrared) | White Light or IR |
| Cleaning Mechanism | Manual | Automated Wiper | Optional Air Blast |
| Max Depth Rating | 100 m | 250 m | N/A (Flow Cell) |
| Communication | USB / Bluetooth | Modbus, SDI-12, RS-485 | 4-20mA / Modbus |
Environmental Factors
When selecting a sensor, consider the expected turbidity range. For drinking water applications, high sensitivity at low levels (0.01 to 1.0 NTU) is paramount. Conversely, in wastewater or dredging applications, the sensor must be capable of measuring up to 4000 FNU without saturating the detector. Temperature compensation is also vital, as the physical properties of water and the electronics of the sensor can shift with thermal changes; YSI sensors include internal thermistors to automatically adjust for these variations.
Installation and Integration Considerations
Successful deployment of a turbidity meter involves more than just submerging a probe. Precise mechanical installation is required to avoid common sources of error.
Avoiding Stray Light and Bubbles
Stray light—ambient light from the sun or overhead fixtures—can enter the sensor and artificially inflate turbidity readings. Sensors should be installed in shaded areas or within opaque pipes/wells.
Air bubbles are perhaps the most common source of error in turbidity measurement. A bubble reflects light just like a solid particle, causing a "spike" in the data. In pressurized pipelines, entrained air can be minimized using de-bubblers or by installing the sensor in a vertical pipe section with upward flow, which helps naturally clear bubbles.
Integration with Level Measurement
In many water treatment and industrial storage applications, turbidity measurement is performed in conjunction with level monitoring. For instance, in a settling tank, monitoring the sludge blanket level is as important as monitoring the turbidity of the effluent.
While turbidity sensors provide data on water quality, high-performance level instruments—such as radar or ultrasonic transmitters—provide the data necessary for volume calculations and pump control. For comprehensive process automation, engineers often integrate these technologies into a single SCADA system. You can find specialized industrial level measurement solutions and technical support for such integrations at the Main Page.
Calibration and Maintenance Protocols
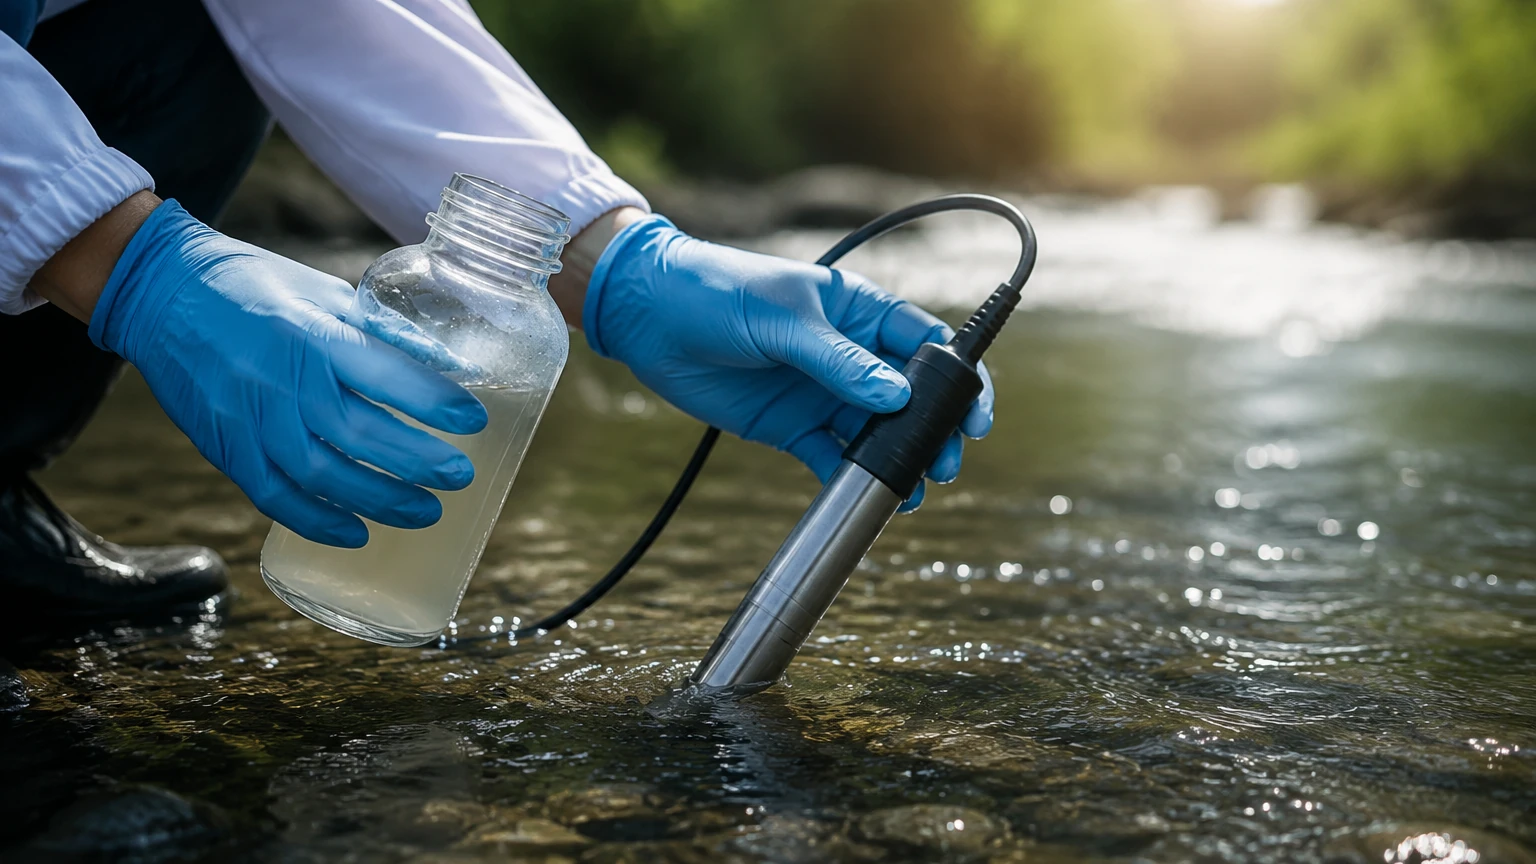
To maintain the B2B standard of data defensibility, a rigorous calibration schedule must be followed. Turbidity meters are not "set and forget" instruments.
Calibration Standards
Two primary standards are used for calibration:
1. Formazin: The traditional primary standard. It is a synthetic polymer that can be mixed to precise turbidity levels. However, it is toxic and has a limited shelf life.
2. AMCO-AEPA-1: A non-toxic alternative consisting of styrene-divinylbenzene copolymer beads. These are highly stable, have a long shelf life, and are often preferred for field use.
Maintenance Cycles
For sensors equipped with wipers, maintenance involves periodically replacing the wiper brush (typically every 6 to 12 months, depending on the environment) and checking the O-rings for integrity. For non-wiped sensors, manual cleaning with a soft cloth and non-abrasive detergent is required weekly or bi-weekly in high-fouling environments.
Common Risks and Limitations
Despite the advanced technology in a YSI turbidity meter, certain conditions can compromise measurement accuracy:
* Particle Size and Shape: Nephelometry assumes a consistent scattering pattern. However, if the nature of the suspended solids changes significantly (e.g., from fine silt to large organic flakes), the NTU reading may change even if the mass concentration of solids remains the same.
* High Solids Concentration: In extremely turbid water (above 4000 FNU), the light beam may be completely absorbed before it reaches the detector, a phenomenon known as "signal attenuation." In these cases, a total suspended solids (TSS) sensor using backscatter technology may be more appropriate.
* Interference from Color: While infrared sensors (ISO 7027) mitigate this, extremely dark-colored water can still absorb some infrared energy, leading to slightly lower readings than actual.
Frequently Asked Questions (FAQs)
Q: How often should I calibrate my YSI turbidity sensor?
A: For most industrial applications, a monthly calibration check is recommended. If the sensor is used in a critical compliance role (such as drinking water discharge), weekly checks may be required by local regulations.
Q: What is the difference between NTU and FNU?
A: NTU (Nephelometric Turbidity Units) typically refers to measurements made with a white light source (EPA 180.1), while FNU (Formazin Nephelometric Units) refers to measurements made with an infrared light source (ISO 7027). For many practical purposes, they are numerically equivalent, but they should not be mixed in official reporting.
Q: Can a turbidity meter measure Total Suspended Solids (TSS)?
A: A turbidity meter measures light scattering, not mass. However, a correlation can often be established between NTU/FNU and TSS (mg/L) for a specific site by performing lab analysis on physical samples and comparing them to sensor readings.
Q: How does flow rate affect turbidity readings?
A: High flow rates can help keep the sensor clean by preventing sediment from settling on the lens. However, extremely high turbulence can create micro-bubbles, which will interfere with the optical path and cause false high readings.
Conclusion
The YSI turbidity meter is a sophisticated tool that provides essential data for process control and environmental protection. By understanding the underlying nephelometric principles, selecting the appropriate hardware for the environment, and ensuring proper integration with other process instruments like level meters, operators can achieve high-accuracy monitoring with minimal downtime. For those looking to expand their process monitoring capabilities, exploring the relationship between water quality and tank inventory through the Main Page is a recommended next step in system design.