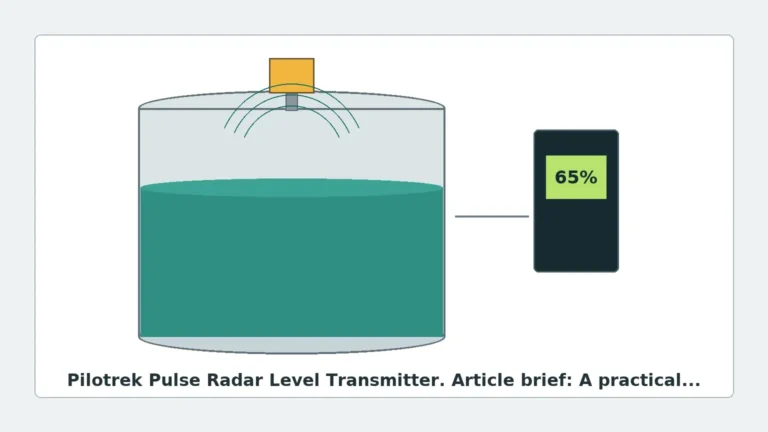
Radar Level Measurement Diagram
Radar Level Measurement Diagram: A Technical Guide to Industrial Implementation
In modern industrial automation, the accuracy of level monitoring is critical for process safety, inventory management, and operational efficiency. Among the various technologies available, Radar Level Meters have emerged as the gold standard for non-contact measurement in challenging environments. Understanding a radar level measurement diagram is the first step for engineers and procurement specialists to ensure that the selected instrument aligns with the physical and chemical constraints of their specific application.
This guide examines the engineering principles behind radar technology, interprets the standard measurement diagrams used in technical documentation, and provides practical selection and installation criteria for industrial B2B environments.
1. Fundamental Measurement Principles
Before analyzing a physical installation diagram, it is essential to understand how radar sensors translate electromagnetic waves into distance data. Industrial radar level transmitters generally operate using one of two primary methods: Pulse Radar or Frequency Modulated Continuous Wave (FMCW).
Pulse Radar (Time of Flight)
In pulse radar systems, the instrument emits a high-frequency microwave pulse toward the product surface. The pulse travels at the speed of light ($c$). When it hits the medium, a portion of the energy is reflected back to the antenna. The sensor measures the time of flight ($t$) between emission and reception. The distance ($D$) is calculated using the formula:
$$D = \frac{c \times t}{2}$$
FMCW (Frequency Modulated Continuous Wave)
FMCW radar transmits a continuous signal with a constantly changing frequency (a frequency sweep). The reflection from the product surface is received and mixed with the currently transmitted signal. Because the frequency is constantly changing, there is a frequency difference between the transmitted and received signals that is proportional to the distance. FMCW is often preferred for high-precision applications due to its superior signal-to-noise ratio.
The Role of the Dielectric Constant (εr)
The reflectivity of the target material is governed by its dielectric constant. Materials with high conductivity or high dielectric constants (such as water, $\epsilon_r \approx 80$) reflect signals strongly. Conversely, hydrocarbons or dry powders with low dielectric constants ($\epsilon_r < 2$) reflect very little energy, requiring high-sensitivity Radar Level Meters and specialized signal processing.
2. Interpreting the Radar Level Measurement Diagram
A standard engineering diagram for radar level measurement typically illustrates the spatial relationship between the sensor, the vessel, and the medium. Key components of these diagrams include:
The Emission Cone and Beam Angle
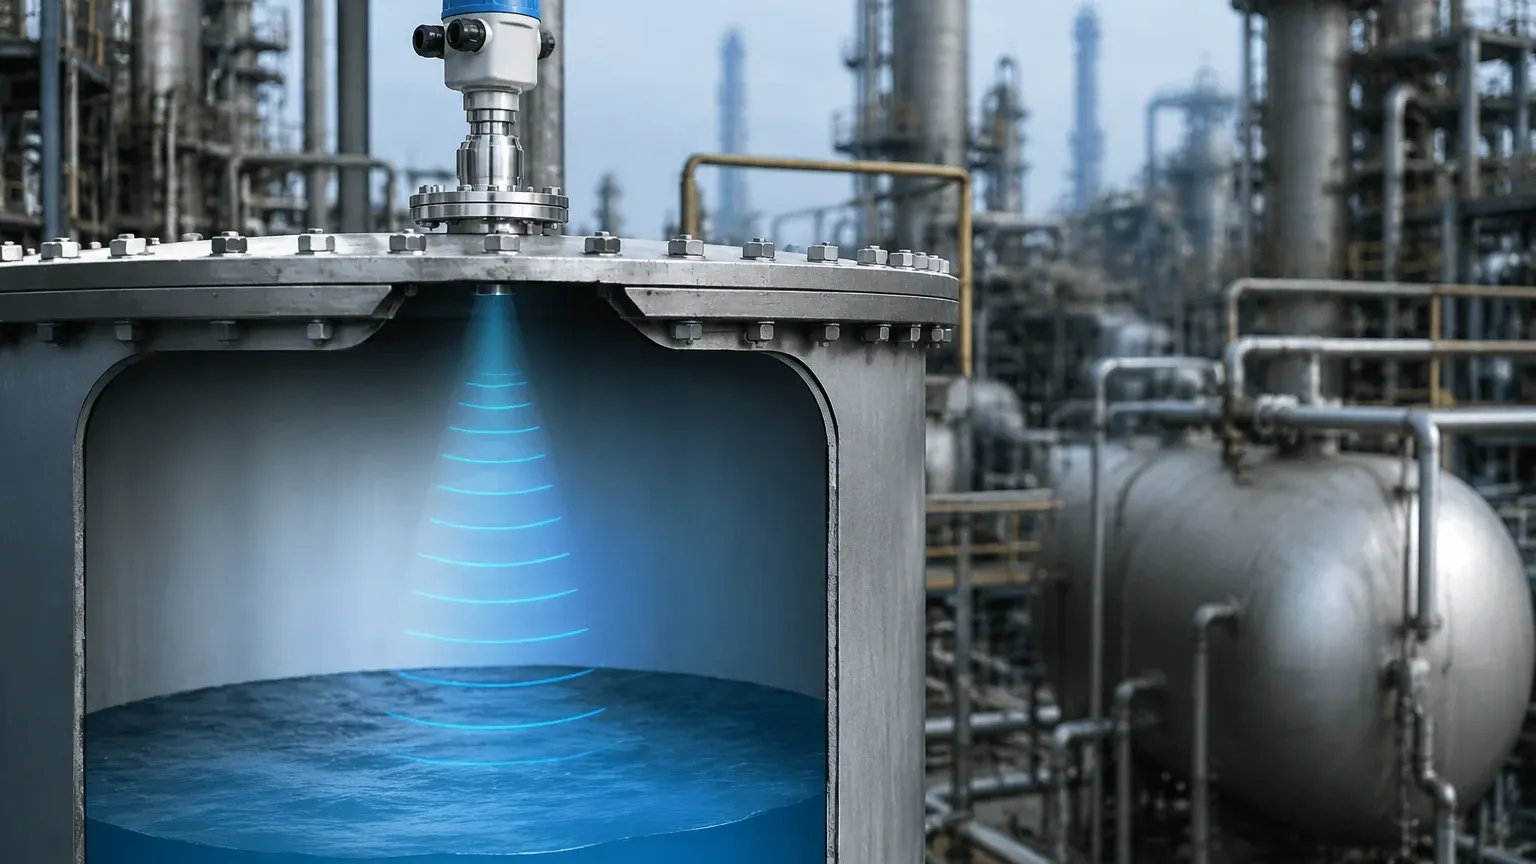
Every radar antenna has a specific beam angle, usually ranging from 3° to 20°. The diagram shows this as a cone extending from the antenna. It is critical that this cone does not intersect with tank walls, ladders, or agitators, as these obstructions create "false echoes" that can interfere with the true level reading.
The Reference Plane
The measurement starts at the reference plane, typically the bottom of the flange or the lower edge of the antenna. The diagram will define:
* Total Range (L): The distance from the reference plane to the tank bottom.
* Measuring Range (M): The actual span where level changes are tracked.
* Blind Zone (Upper Blocking Distance): A small area immediately below the antenna where measurement is not possible due to signal ringing.
The Echo Curve (Envelope Curve)
In digital commissioning tools, the "diagram" often refers to the echo curve. This is a graphical representation of signal strength (amplitude) versus distance. A clean diagram shows a sharp peak at the product surface and a flat baseline elsewhere. Engineers use this diagram to perform "false echo suppression," telling the software to ignore static peaks caused by internal tank structures.
3. Technology Selection Criteria
Choosing the right radar frequency and antenna type is vital for long-term reliability. The following table compares the most common configurations found in industrial projects.
| Feature | 6 GHz (C-Band) | 26 GHz (K-Band) | 80 GHz (W-Band) |
| :— | :— | :— | :— |
| Beam Angle | Wide (approx. 20°) | Medium (approx. 8-10°) | Narrow (approx. 3°) |
| Penetration | High (Good for heavy steam/foam) | Moderate | Low (Easily blocked by heavy foam) |
| Accuracy | ±5 mm to ±10 mm | ±2 mm to ±5 mm | ±1 mm |
| Antenna Size | Large (DN150+) | Medium (DN50-DN100) | Small (DN20-DN50) |
| Best Use Case | Large turbulent tanks with foam | Standard chemical storage | Small vessels, tall nozzles, high precision |
4. Installation Considerations and Constraints
To ensure the accuracy depicted in a radar level measurement diagram, the physical installation must follow strict engineering guidelines. Failure to adhere to these can result in signal loss or erratic readings.
Positioning and Orientation
1. Avoid the Center: Never install a radar sensor in the exact center of a dome-roof tank. The parabolic shape of the roof can focus multiple reflections back to the sensor, causing signal saturation.
2. Wall Distance: The sensor should be placed at least 200 mm (approx. 8 inches) away from the tank wall. However, it must be close enough to avoid internal obstructions like heating coils.
3. Nozzle Geometry: The antenna should ideally extend slightly past the bottom of the mounting nozzle. If the nozzle is very long (a "high-neck" nozzle), an 80 GHz radar is required because its narrow beam can exit the nozzle without reflecting off the inner walls.
Obstructions and Agitators
If the tank contains an agitator, the radar should be mounted such that the signal path is perpendicular to the blades when they are stationary. Most modern transmitters include software algorithms to filter out the intermittent signals caused by moving blades, provided the primary reflection from the liquid remains stronger than the interference.
5. Industrial Application Scenarios
Water and Wastewater Treatment
In open-channel flow or wet well monitoring, radar is preferred over ultrasonic sensors because it is unaffected by air temperature fluctuations, wind, or surface vapors. A typical diagram for this application shows the sensor mounted on a bracket over the water, with the beam directed at the center of the channel.
Chemical and Petrochemical
For volatile liquids stored under high pressure, radar sensors are often mounted on bypass pipes or stilling wells. The stilling well acts as a waveguide, concentrating the signal and eliminating surface turbulence or foam. In these diagrams, the "measuring range" is confined within the vertical pipe.
Solids and Powders
Measuring the level of grain, cement, or plastic pellets presents unique challenges. Solids do not form a flat surface; they create cones of repose. The radar level measurement diagram for solids must account for the angle of repose and the high dust environment. High-frequency 80 GHz radars are typically used here to penetrate dust and focus on a specific point of the material cone.
6. Limitations and Risks
While highly versatile, radar technology has specific limitations that must be managed during the design phase:
* Heavy Foam: Extremely thick, dense foam can absorb the radar signal entirely, preventing any reflection from reaching the sensor. In these cases, a Guided Wave Radar (GWR) or a lower frequency (6 GHz) unit may be necessary.
* Vacuum Conditions: While radar works in a vacuum (unlike ultrasonic), the mechanical seals and flange ratings of the instrument must be verified for the specific process pressure.
* Low Dielectric Media: If the medium has a dielectric constant below 1.4 (e.g., liquid nitrogen or certain solvents), the reflection may be too weak for standard non-contact radar. Stilling wells or GWR probes are the standard engineering solutions.
7. Engineering FAQ
Q: How does a radar level measurement diagram help in troubleshooting?
A: By comparing the theoretical diagram (the physical tank layout) with the real-time echo curve diagram, technicians can identify if a new obstruction (like a buildup of material on a sensor) is causing a false high-level reading.
Q: Can radar measure through a plastic tank lid?
A: Yes. Microwaves can penetrate non-conductive materials like plastic, glass, or fiberglass. This allows for "contained" measurement where the sensor is mounted outside a plastic IBC or tank, provided the material doesn't contain carbon black or metallic reinforcement.
Q: What is the difference between "Accuracy" and "Repeatability" in these diagrams?
A: Accuracy refers to how close the measurement is to the actual physical distance (e.g., ±2 mm). Repeatability refers to the sensor's ability to provide the same reading under identical conditions. In process control, high repeatability is often more important than absolute accuracy.
Q: Does the temperature of the gas space affect the diagram?
A: No. Unlike ultrasonic waves, which depend on air density and temperature, radar waves are electromagnetic and travel at a constant speed regardless of the gas composition, temperature, or pressure in the vessel.
8. Summary for Technical Procurement
When reviewing specifications for industrial level measurement, the radar level measurement diagram serves as the primary reference for ensuring mechanical compatibility. International buyers should confirm the following data points with their supplier:
1. Process Connection: Flange size (DN/ANSI) and material (316L Stainless Steel, PTFE coating, etc.).
2. Frequency Requirement: Based on tank height and internal obstructions.
3. Signal Output: 4-20mA HART, Modbus RS485, or Profibus.
4. Hazardous Area Ratings: ATEX, IECEx, or SIL2/3 requirements for safety-instrumented systems.
By following these factual guidelines and understanding the underlying physics illustrated in the measurement diagrams, engineering teams can implement robust level control solutions that minimize maintenance and maximize uptime.