Radar Level Sensor Diagram
Understanding Radar Level Sensor Diagrams and Industrial Implementation
In the landscape of industrial process automation, accurate level measurement is critical for safety, inventory management, and process efficiency. Among the various technologies available, radar-based systems have emerged as a gold standard due to their non-contact nature and reliability in harsh environments. To successfully integrate these instruments, engineers and procurement specialists must understand the fundamental radar level sensor diagram, the underlying physics of microwave propagation, and the mechanical constraints of installation.
This guide provides a technical overview of radar level measurement, detailing how Radar Level Meters function, how to interpret their technical schematics, and the criteria for selecting the appropriate frequency and antenna design for specific industrial applications.
Measurement Principles: How Radar Sensors Work
Radar level sensors operate using electromagnetic waves, typically in the microwave spectrum. Unlike ultrasonic sensors, which rely on sound waves and are affected by air temperature and pressure, radar waves travel at the speed of light and are largely independent of the vapor space characteristics. There are two primary methods used in industrial radar measurement: Pulse Radar and Frequency Modulated Continuous Wave (FMCW).
Time-of-Flight (Pulse Radar)
Pulse radar instruments emit a short microwave pulse toward the product surface. The pulse reflects off the medium and returns to the sensor antenna. The instrument measures the time elapsed between emission and reception. The distance is calculated using the formula:
D = (c × t) / 2
Where:
* D is the distance to the product surface.
* c is the speed of light (~300,000 km/s).
* t is the measured transit time.
Frequency Modulated Continuous Wave (FMCW)
FMCW radar emits a continuous signal with a constantly changing frequency (a frequency sweep). When the reflected signal is received, it is compared to the signal being emitted at that exact moment. The frequency difference between the two is directly proportional to the distance. FMCW is generally preferred for high-precision applications and agitated surfaces because it provides better signal-to-noise ratios.
Analyzing the Radar Level Sensor Diagram
A technical radar level sensor diagram typically illustrates both the internal electronic architecture and the external mechanical installation. Understanding these diagrams is essential for troubleshooting and ensuring the device is compatible with existing control systems.
Internal Electronic Schematic
From an electronics perspective, the diagram consists of several key modules:
1. Oscillator/Signal Generator: Creates the high-frequency microwave signal (e.g., 26GHz or 80GHz).
2. Directional Coupler: Directs the generated signal to the antenna and the reflected signal to the receiver.
3. Antenna System: Transmits the signal into the vessel and collects the return echo.
4. Receiver and Signal Processor: Converts the high-frequency microwave return into a digital signal. This section often includes "Echo Discovery" software to filter out false reflections from internal tank structures.
5. Output Module: Converts the processed data into a standard industrial signal, such as 4-20mA HART, Modbus RS485, or Profibus.
External Installation Layout
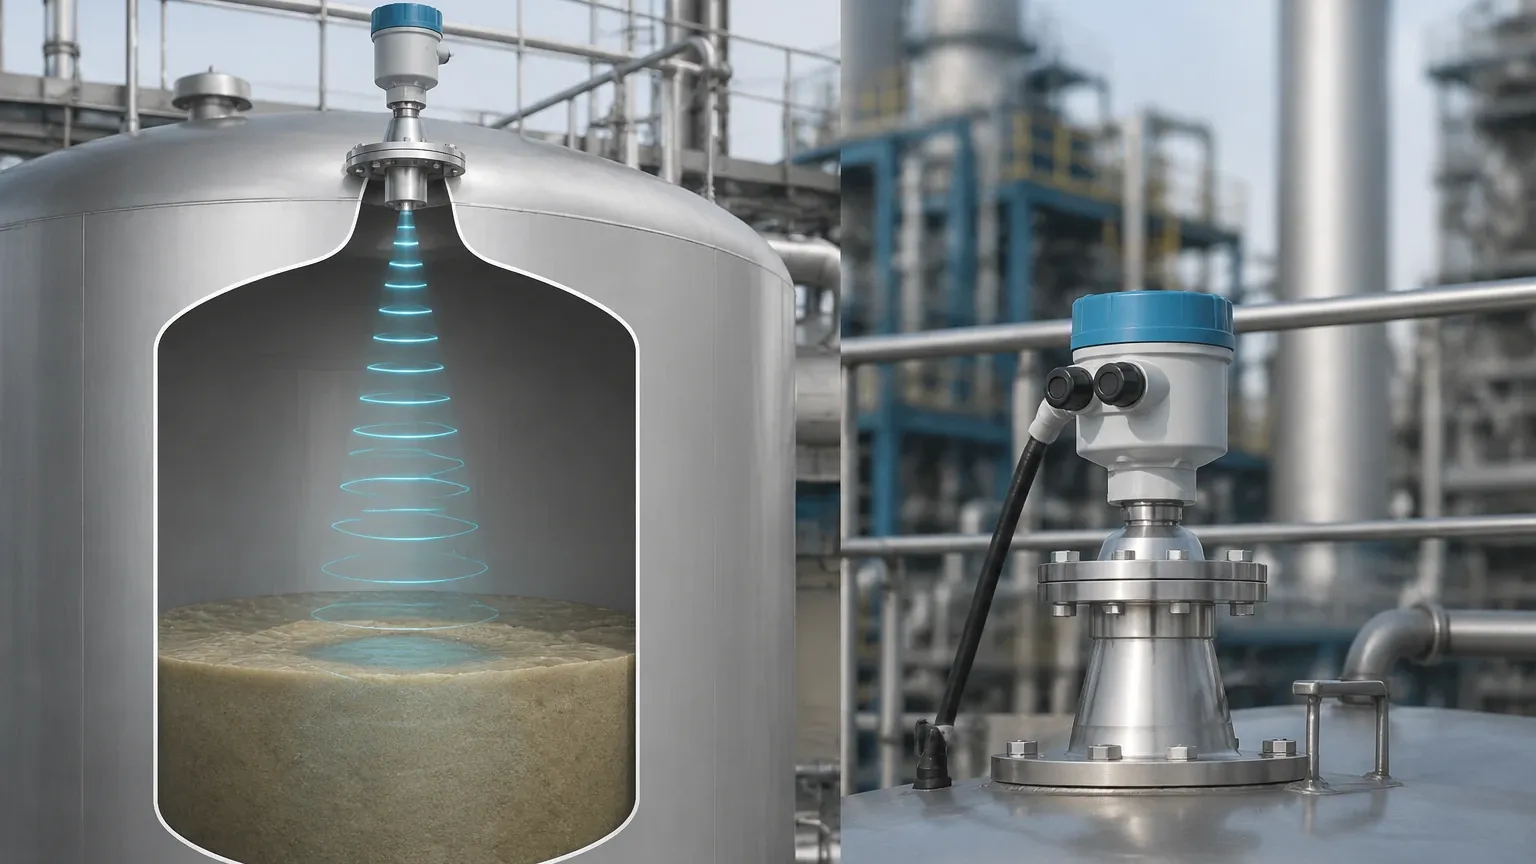
The installation diagram shows the physical relationship between the sensor and the vessel. Key components include:
* The Blind Zone (Blocking Distance): The area immediately below the antenna (typically 50mm to 200mm / ~2 to 8 inches) where measurements cannot be taken accurately.
* Beam Angle: The conical spread of the microwave signal. A narrower beam angle is usually preferred to avoid hitting ladders, agitators, or heating coils.
* Process Connection: The flange or thread that secures the sensor to the tank nozzle.
Selection Criteria for Industrial Applications
Choosing the right radar instrument requires a deep dive into the physical properties of the medium and the vessel's environment. The following factors are decisive in the selection process.
Dielectric Constant (εr)
The reflectivity of a material depends on its dielectric constant. Materials with high dielectric constants (like water, εr ≈ 80) reflect signals strongly. Hydrocarbons and dry solids often have low dielectric constants (εr < 3), requiring more sensitive electronics and specialized antenna designs to ensure a reliable return signal.
Frequency Bands: 26GHz vs. 80GHz
The frequency of the radar determines the beam angle and the sensor's ability to penetrate dust or steam.
| Feature | 26GHz Radar | 80GHz Radar |
| :— | :— | :— |
| Beam Angle | Wider (approx. 10° – 20°) | Narrow (approx. 3° – 8°) |
| Antenna Size | Larger required for narrow beam | Very compact |
| Dust/Steam Penetration | Excellent | Good, but can be attenuated by heavy buildup |
| Precision | ±3mm to ±5mm | ±1mm |
| Best Use Case | Large silos, heavy steam, turbulent liquids | Small tanks, narrow nozzles, high-precision liquids |
Installation Guidelines and Constraints
To ensure the radar level sensor diagram translates into a functioning real-world application, engineers must follow strict installation protocols. Improper mounting is the leading cause of signal loss and measurement error.
1. Nozzle Height and Diameter: The antenna should ideally extend slightly beyond the bottom of the mounting nozzle to prevent "ringing" or internal reflections within the nozzle itself. If the nozzle is very long, a wave guide or a specific antenna extension may be required.
2. Positioning: The sensor should never be mounted in the center of a tank with a domed top, as this can create multiple false echoes. It should also be placed away from the filling inlet to avoid measuring the falling stream of material.
3. Obstruction Clearance: Use the beam angle calculation to ensure the microwave cone does not intersect with internal tank components like ladders or limit switches. For a 10-meter (32.8 ft) tank with an 8° beam, the signal footprint at the bottom is approximately 1.4 meters (4.6 ft) wide.
4. Orientation: For solid materials, the sensor may need a swiveling flange to aim the beam at the angle of repose of the material pile.
Limitations and Application Risks
While Radar Level Meters are incredibly versatile, they are not universal solutions. Engineers must be aware of specific environmental risks:
* Heavy Foam: Dense, thick foam can absorb the radar signal entirely, preventing any reflection. In these cases, a Guided Wave Radar (GWR) or a displacement-based system may be more appropriate.
* Vacuum Conditions: While radar works in a vacuum, the sealing materials of the antenna (such as PTFE or PEEK) must be rated for the specific pressure and temperature of the process.
* Condensation and Buildup: While 80GHz radars handle some buildup well, heavy crystallization on the antenna lens will eventually attenuate the signal. Integrated air purges or "dust covers" are recommended for these environments.
Frequently Asked Questions (FAQ)
Q: Can radar level sensors measure interface levels?
A: Standard non-contact radar is generally used for the top level. For measuring the interface between two liquids (e.g., oil and water), Guided Wave Radar (GWR) is the preferred technology as it can detect the change in dielectric constant at the boundary layer.
Q: Is it necessary to empty the tank to calibrate the sensor?
A: No. Most modern radar sensors are pre-calibrated at the factory. Field adjustments are typically done via software by entering the tank height and the desired measurement range. This is a significant advantage over hydrostatic pressure sensors.
Q: How does the dielectric constant affect the maximum measuring range?
A: The lower the dielectric constant, the shorter the effective range. For example, a sensor that can measure water up to 30 meters (98.4 ft) might only be able to measure plastic pellets (low εr) up to 15 meters (49.2 ft).
Q: What maintenance is required for radar level meters?
A: Because they have no moving parts, maintenance is minimal. Periodic inspections of the antenna for buildup and checking the integrity of the cable glands are usually sufficient.
Conclusion for Engineering Procurement
When reviewing a radar level sensor diagram for a new project, the focus should remain on the compatibility between the instrument's frequency, the antenna geometry, and the physical constraints of the vessel. For most modern liquid applications, 80GHz technology offers the easiest installation due to its narrow beam and compact size. However, for extreme environments involving heavy dust or very low dielectric solids, the robust nature of 26GHz systems remains highly relevant.
By prioritizing a clear understanding of the signal path and the reflection characteristics of the target medium, industrial facilities can achieve reliable, maintenance-free level monitoring that supports long-term operational goals.