Conductivity Data Logger
Conductivity Data Logger
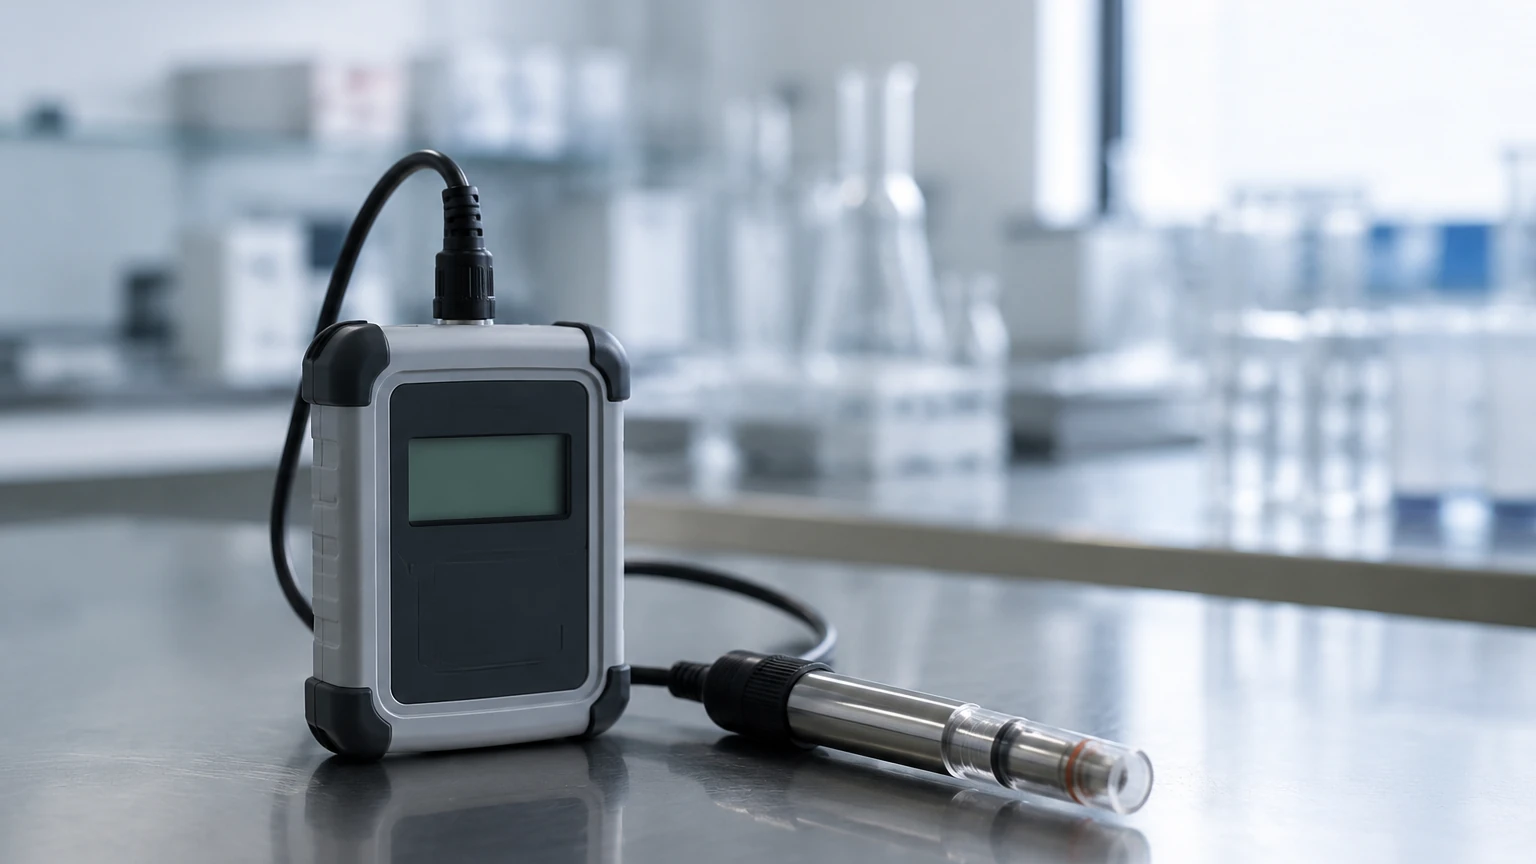
In industrial process control and environmental monitoring, the ability to track the ionic content of a liquid over time is critical for maintaining water quality, process efficiency, and regulatory compliance. A conductivity data logger serves as an integrated solution that combines a conductivity sensor with an electronic recording unit. Unlike standard real-time transmitters that require a constant connection to a central PLC (Programmable Logic Controller), a data logger can operate autonomously, capturing and storing measurements at set intervals for later analysis or remote transmission.
For engineers and facility managers, selecting the right instrumentation requires a deep understanding of the electrochemical principles at play, the hardware architecture of the logging unit, and the specific demands of the application environment. As a professional manufacturer, Welk provides high-precision instruments designed to meet these rigorous industrial standards.
Principles of Conductivity Measurement
Before evaluating a conductivity data logger, it is essential to understand the two primary methods used to measure electrical conductivity in liquids: contacting and inductive (toroidal) sensing.
Contacting Conductivity Sensors
Contacting sensors utilize two or more electrodes (usually made of stainless steel, graphite, or titanium) that come into direct physical contact with the process fluid. An AC voltage is applied between the electrodes, and the resulting current is measured. According to Ohm’s Law, the conductance is the reciprocal of resistance. To convert this to conductivity (expressed in Siemens per meter, S/m, or more commonly microsiemens per centimeter, µS/cm), the instrument accounts for the "cell constant" ($K$), which is the ratio of the distance between the electrodes to their surface area.
* 2-Electrode Systems: Best suited for low-conductivity applications such as pure water or boiler condensate.
* 4-Electrode Systems: These utilize two drive electrodes and two sensing electrodes to minimize the effects of polarization and electrode fouling, making them suitable for a wider range of industrial applications.
Inductive (Toroidal) Conductivity Sensors
Inductive sensors do not use electrodes. Instead, they consist of two wire-wound metal toroids encased in a plastic or ceramic housing (often PEEK or PFA). One toroid acts as a transmitter, creating an alternating magnetic field that induces an electric current in the surrounding conductive liquid. This current, in turn, induces a signal in the second (receiver) toroid.
Because there is no metal-to-liquid contact, inductive sensors are virtually immune to fouling, scaling, and corrosion. They are the preferred choice for high-conductivity liquids, wastewater, and aggressive chemical processes where a standard conductivity data logger with contacting probes would fail prematurely.
Temperature Compensation
Conductivity is highly dependent on temperature; for most aqueous solutions, conductivity increases by approximately 2% for every 1°C (1.8°F) rise in temperature. A professional conductivity data logger must include an integrated temperature sensor (typically a Pt100 or Pt1000 RTD) and provide Automatic Temperature Compensation (ATC) to normalize readings to a reference temperature, usually 25°C (77°F).
The Architecture of a Conductivity Data Logger
A modern conductivity data logger is more than just a sensor; it is a sophisticated electronic system designed for data integrity and longevity in harsh environments. The core components typically include:
1. The Analog-to-Digital Converter (ADC): High-resolution ADCs (often 16-bit or 24-bit) are required to capture the subtle changes in voltage or current from the sensor and convert them into digital values.
2. Microprocessor and Memory: The internal processor manages the sampling frequency—ranging from once per second to once per day—and stores the timestamped data in non-volatile flash memory. This ensures that data is not lost if the battery fails.
3. Power Management: For remote or submersed applications, power efficiency is paramount. Loggers often use high-capacity lithium batteries designed to last for several years under standard sampling rates.
4. Communication Interface: Data retrieval can occur via physical ports (USB, RS485/Modbus), short-range wireless (Bluetooth), or long-range telemetry (LoRaWAN, NB-IoT, or 4G/5G).
Key Evaluation Criteria for Industrial Selection
When specifying a conductivity data logger for a project, engineers must look beyond the basic measurement range. The following factors determine the long-term reliability and total cost of ownership.
Measurement Range and Resolution
Conductivity can span several orders of magnitude, from 0.055 µS/cm (ultrapure water) to over 1,000 mS/cm (concentrated acids). It is vital to select a logger whose sensor cell constant is optimized for the expected range. A logger designed for seawater (approx. 50,000 µS/cm) will lack the resolution needed for monitoring demineralized water.
Material Compatibility
The housing of the logger and the sensor must withstand the chemical properties of the fluid. For wastewater, PVC or Polypropylene may suffice. However, for high-temperature or chemically aggressive industrial fluids, PEEK (Polyether ether ketone) and Stainless Steel 316L are industry standards. If the logger is to be fully submerged, the IP (Ingress Protection) rating must be IP68.
Data Storage and Sampling Logic
Consider the duration of the deployment. If a logger samples every 15 minutes, it will generate approximately 35,000 data points per year. Ensure the internal memory can accommodate the project duration or that the logger supports "wrap-around" memory (overwriting the oldest data) or burst logging (increasing the sampling rate when certain thresholds are met).
Ease of Calibration
All conductivity sensors drift over time due to electrode aging or environmental buildup. A high-quality conductivity data logger should feature a user-friendly calibration interface, allowing for single-point or multi-point calibration using standard conductivity solutions (e.g., 1413 µS/cm or 12.88 mS/cm).
Practical Selection Table
| Feature | Contacting (2-Electrode) | Contacting (4-Electrode) | Inductive (Toroidal) |
| :— | :— | :— | :— |
| Best Use Case | Pure/Ultrapure Water | General Industrial/River Water | Chemicals/High Fouling/Slurry |
| Conductivity Range | 0 – 200 µS/cm | 10 µS/cm – 200 mS/cm | 100 µS/cm – 2,000 mS/cm |
| Fouling Resistance | Low | Moderate | Excellent |
| Maintenance Needs | High (Frequent Cleaning) | Moderate | Low |
| Typical Accuracy | ±1% of Reading | ±1-2% of Reading | ±2% of Reading |
Installation and Maintenance Considerations
Proper installation is as critical as the hardware itself. For a conductivity data logger to provide accurate data, the sensor must be fully immersed in a representative flow of the liquid.
Avoiding Air Bubbles
Air is non-conductive. If air bubbles trap themselves against the electrodes of a contacting sensor or inside the bore of a toroidal sensor, the logger will report a conductivity value significantly lower than the actual level. In piping systems, sensors should be installed on the side or bottom of the pipe, and never at the top where air pockets collect.
Grounding and Interference
In industrial plants with large motors or variable frequency drives (VFDs), electrical noise can interfere with the low-voltage signals of a conductivity sensor. Ensuring the logger is properly grounded and using shielded cables for any external sensor connections is essential to prevent data spikes.
Biofouling and Scaling
In environmental monitoring or cooling tower applications, biological growth (algae) or mineral scaling (calcium carbonate) can coat the sensor. Even a thin film can insulate the electrodes. Regular maintenance cycles should include physical cleaning with a soft brush and, if necessary, a mild acid dip to remove scale. For remote deployments, choosing a logger with an integrated mechanical wiper can significantly extend the time between manual cleanings.
Limitations and Frequently Asked Questions
Can a conductivity data logger measure Salinity or TDS?
Yes. Salinity and Total Dissolved Solids (TDS) are calculated values derived from conductivity. Most professional loggers allow the user to input a TDS conversion factor (typically between 0.5 and 0.7) to provide these readings automatically.
What are the limitations regarding cable length?
For loggers where the sensor is separate from the recording unit, cable length is limited by the capacitance of the cable, which can interfere with the AC signal. Generally, contacting sensors are limited to 30 meters (approx. 100 feet) unless a pre-amplifier is used. Inductive sensors are less sensitive to cable length but still require careful routing.
How often should the battery be replaced?
This depends on the sampling interval and data transmission method. A logger recording every 15 minutes without wireless transmission can often last 3 to 5 years. If the logger uses cellular telemetry to upload data daily, the battery life may drop to 1 to 2 years.
Conclusion
A conductivity data logger is an indispensable tool for modern industrial and environmental management. By providing a continuous record of water chemistry, these devices enable proactive maintenance, ensure process stability, and provide the data necessary for environmental stewardship. When selecting an instrument, prioritize the measurement principle that matches your fluid's characteristics and ensure the hardware is robust enough for the intended environment.
For more information on high-performance level and analytical instrumentation, visit our Main Page to explore our full range of industrial solutions. Whether you require radar level meters or advanced water quality sensors, Welk offers the technical expertise and reliable hardware needed to optimize your operations.