Ultrasonic Level Measurement Diagram
Ultrasonic Level Measurement Diagram: A Technical Guide to Non-Contact Sensing
In the field of industrial automation, precise liquid and solid level monitoring is essential for operational safety and efficiency. Among the various technologies available, Ultrasonic Level Meters have become a standard choice for non-contact measurement. Understanding the technical nuances of these devices requires a clear grasp of their operational logic, often represented through an ultrasonic level measurement diagram.
This guide provides a comprehensive overview of how ultrasonic systems function, the critical components involved, and the practical engineering considerations for successful implementation in water treatment, chemical processing, and industrial storage applications.
Understanding the Measurement Principle
Before analyzing an ultrasonic level measurement diagram, it is necessary to understand the underlying physics. Ultrasonic level measurement is based on the "Time-of-Flight" (ToF) principle.
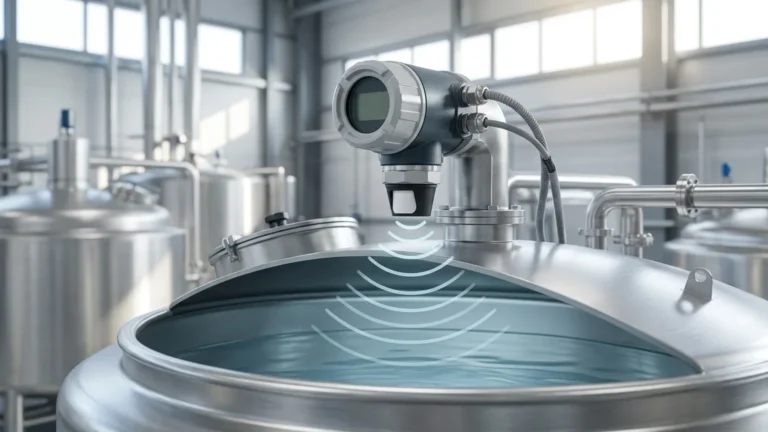
The sensor, typically a piezoelectric transducer, emits a high-frequency acoustic pulse. This sound wave travels through the air at a known velocity, strikes the surface of the medium (liquid or solid), and reflects back toward the sensor. The instrument measures the time interval between the emission of the pulse and the reception of the echo.
The Mathematical Formula
The distance from the sensor to the material surface is calculated using the following equation:
$$D = \frac{c \times t}{2}$$
Where:
* D is the distance to the surface (m).
* c is the speed of sound in the medium (m/s).
* t is the total transit time (s).
Since the pulse travels to the surface and back, the total distance is divided by two. The actual level ($L$) in a tank of height ($H$) is then determined by subtracting the measured distance from the total height: $L = H – D$.
Components of an Ultrasonic Level Measurement Diagram
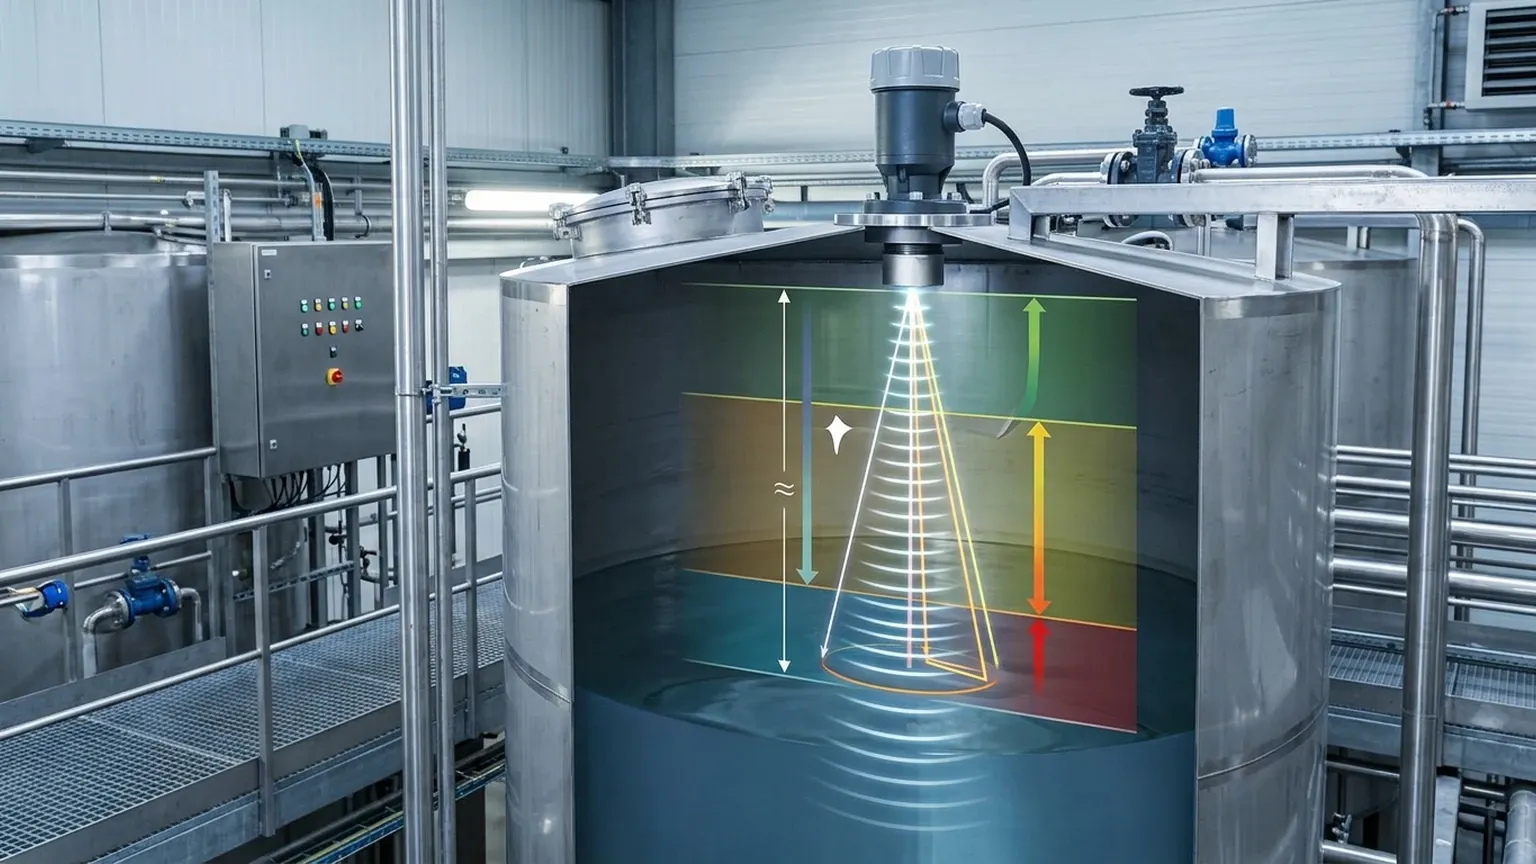
A standard ultrasonic level measurement diagram serves as a blueprint for engineers to visualize the interaction between the sensor and the process environment. Key elements depicted in such diagrams include:
1. The Transducer Face: The point of origin for the acoustic signal.
2. The Blanking Distance (Dead Zone): A small region directly below the sensor where measurement is impossible because the transducer is still vibrating from the initial pulse and cannot yet "hear" an incoming echo. This typically ranges from 0.2m to 0.5m depending on the model.
3. The Beam Angle: Ultrasonic waves do not travel in a straight line but rather in a conical shape. The beam angle (usually between $5^\circ$ and $12^\circ$) defines the area that must remain clear of obstructions like ladders, pipes, or agitators.
4. The Target Surface: The interface between the air and the material being measured.
5. The Echo Signal: The reflected wave returning to the transducer.
Technical Selection Criteria
Choosing the right Ultrasonic Level Meters requires matching instrument specifications to the specific demands of the application. The following table outlines typical selection parameters for industrial-grade units.
Selection Table: Ultrasonic Level Meter Specifications
| Feature | Standard Liquid Sensor | Long-Range Solids Sensor | High-Precision Chemical Sensor |
| :— | :— | :— | :— |
| Measurement Range | 0.4m – 10m | 0.8m – 30m | 0.25m – 15m |
| Accuracy | $\pm$ 0.5% of Span | $\pm$ 1.0% of Span | $\pm$ 0.2% of Span |
| Beam Angle | $10^\circ$ to $12^\circ$ | $8^\circ$ to $10^\circ$ | $5^\circ$ to $8^\circ$ |
| Operating Temp. | -20$^\circ$C to +60$^\circ$C | -40$^\circ$C to +80$^\circ$C | -40$^\circ$C to +95$^\circ$C |
| Output Signal | 4-20mA / HART | 4-20mA / RS485 | 4-20mA / Modbus / HART |
| Enclosure Rating | IP65 / IP66 | IP67 | IP68 / Explosion-proof |
Installation Considerations and Best Practices
Proper installation is the most critical factor in ensuring the accuracy of an ultrasonic level measurement system. An ultrasonic level measurement diagram often highlights the "Do's and Don'ts" of mounting to prevent signal interference.
1. Perpendicular Alignment
The transducer must be mounted perfectly perpendicular to the surface of the medium. If the sensor is tilted, the acoustic pulse will reflect away from the transducer rather than back toward it, resulting in a "Loss of Echo" (LOE) error.
2. Avoiding the "Dead Zone"
Ensure the highest expected liquid level never enters the blanking distance. If the liquid reaches this zone, the sensor will provide erratic readings or fail to register the level entirely. Engineers often use a mounting nozzle or standpipe to raise the sensor if the tank must be filled to the very top.
3. Obstruction Clearance
Because of the conical beam angle, the sensor must be placed far enough away from the tank wall and internal structures. As a rule of thumb, the sensor should be placed at least 200mm away from the wall for every 1 meter of depth to avoid false echoes from weld seams or wall buildup.
4. Environmental Factors
* Temperature Gradients: The speed of sound changes with temperature. Quality Ultrasonic Level Meters include an integrated temperature sensor to compensate for these changes automatically.
* Vapors and Gases: If the tank contains heavy vapors or gases other than air (such as CO2 or methane), the speed of sound will differ significantly, requiring manual calibration of the sound velocity constant.
Limitations of Ultrasonic Technology
While ultrasonic sensors are versatile, they are not universal solutions. Certain conditions can attenuate or scatter the acoustic signal, leading to unreliable data:
* Heavy Foam: Foam acts as an acoustic absorber. If the surface is covered in thick, dense foam, the pulse may not reflect back to the sensor.
* Vacuum Conditions: Sound requires a medium (air/gas) to travel. In a vacuum, ultrasonic measurement is impossible.
* High Pressure: Extreme pressure changes the density of the air, which can affect the signal's propagation and accuracy.
* Extreme Turbulence: Rapidly churning liquids can scatter the echo. In these cases, a stilling well may be required to provide a calm surface for measurement.
Practical Application: Wastewater Management
In wastewater treatment plants, ultrasonic sensors are frequently used in open channel flow measurement and wet well monitoring. A typical ultrasonic level measurement diagram for an open channel would show the sensor mounted above a flume or weir. The meter converts the level reading into a flow rate (e.g., liters per second) based on the geometry of the primary device. Because the sensor does not touch the corrosive sewage, maintenance requirements are significantly lower than for submerged pressure transducers.
Frequently Asked Questions (FAQs)
Q1: Can ultrasonic level meters measure solids like grain or sand?
Yes, but with caveats. Solids often have an uneven surface that scatters the sound wave. Furthermore, dust generated during filling can attenuate the signal. For solids, sensors with higher power and narrower beam angles are typically required.
Q2: What is the difference between a two-wire and a four-wire ultrasonic meter?
A two-wire system uses the same pair of wires for both power supply and the 4-20mA output signal, making it easier to install. A four-wire system has separate wires for power (often 24VDC or 220VAC) and signal, which allows for higher power output and is better suited for long-range or difficult applications.
Q3: How do I handle a tank with an agitator?
If an agitator is present, it will appear in the ultrasonic level measurement diagram as a potential obstruction. Modern sensors feature "False Echo Suppression" or "Echo Mapping" software. This allows the user to program the meter to ignore stationary objects (like agitator blades or brackets) and only track the moving surface of the liquid.
Q4: Does the color of the liquid affect the measurement?
No. Unlike optical sensors or lasers, ultrasonic waves are unaffected by the color, transparency, or dielectric constant of the material. They only require a physical surface capable of reflecting sound.
Conclusion
Visualizing the measurement process through an ultrasonic level measurement diagram is the first step in designing a reliable monitoring system. By understanding the relationship between beam angles, blanking distances, and environmental variables, engineers can select the most effective Ultrasonic Level Meters for their specific needs. When installed correctly and calibrated for the local environment, these instruments provide a low-maintenance, high-accuracy solution for a vast array of industrial level sensing challenges.