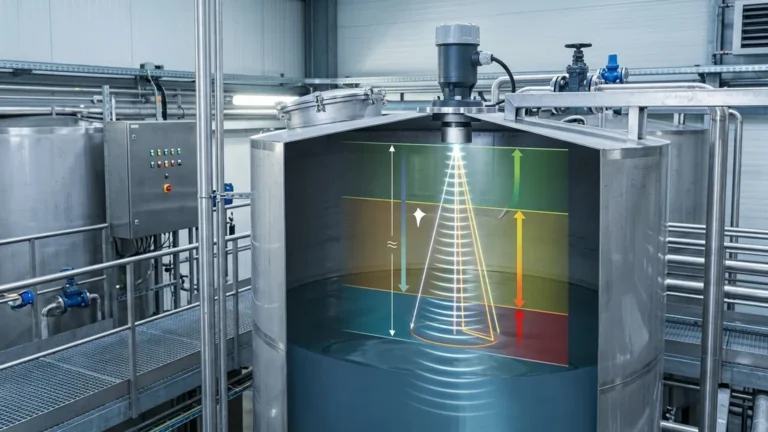
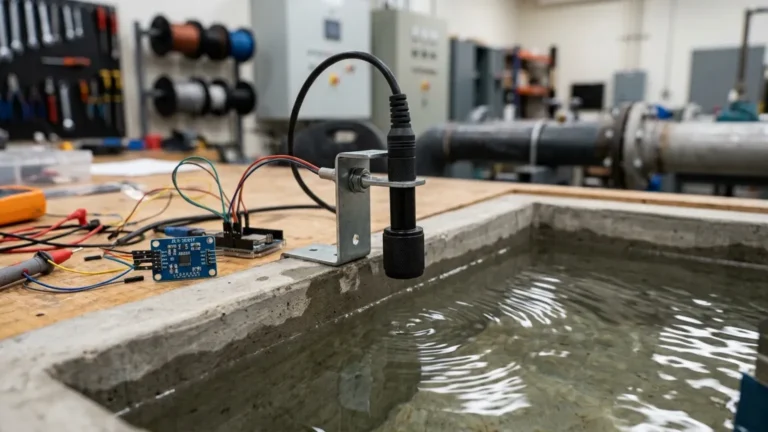
Ultrasonic Level Sensor Diagram
Understanding the Ultrasonic Level Sensor Diagram: A Technical Guide for Industrial Applications
In the field of industrial process control, accurate liquid and solid level measurement is essential for operational efficiency and safety. Among the various technologies available, Ultrasonic Level Meters have become a preferred choice due to their non-contact nature, ease of installation, and cost-effectiveness. However, successful implementation requires more than just purchasing a device; it requires a deep understanding of the instrument's internal logic and external connectivity, typically represented in an ultrasonic level sensor diagram.
This guide provides a comprehensive technical overview of ultrasonic level measurement, detailing the principles of operation, interpreting standard wiring and installation diagrams, and offering practical selection criteria for engineering professionals.
The Principle of Ultrasonic Level Measurement
Before analyzing a specific ultrasonic level sensor diagram, it is vital to understand the physics governing the measurement. Ultrasonic sensors operate on the "Time-of-Flight" (ToF) principle.
Signal Generation and Reflection
The sensor’s transducer contains a piezoelectric crystal that converts electrical energy into high-frequency sound waves (typically between 20 kHz and 200 kHz). These sound pulses travel through the air or vapor space in a tank, strike the surface of the material being measured, and reflect back toward the sensor as an echo.
The Distance Calculation
The internal microprocessor of the Ultrasonic Level Meters calculates the time elapsed between the emission of the pulse and the reception of the echo. The distance from the sensor to the material surface is determined using the following formula:
D = (c × t) / 2
Where:
* D is the distance to the surface (m).
* c is the speed of sound in the medium (approximately 343 m/s in air at 20°C).
* t is the total time for the round trip (s).
Because the speed of sound varies with temperature, most professional-grade sensors, such as those manufactured by Welk, include an integrated temperature sensor to provide automatic compensation, ensuring accuracy across varying environmental conditions.
Interpreting the Ultrasonic Level Sensor Diagram
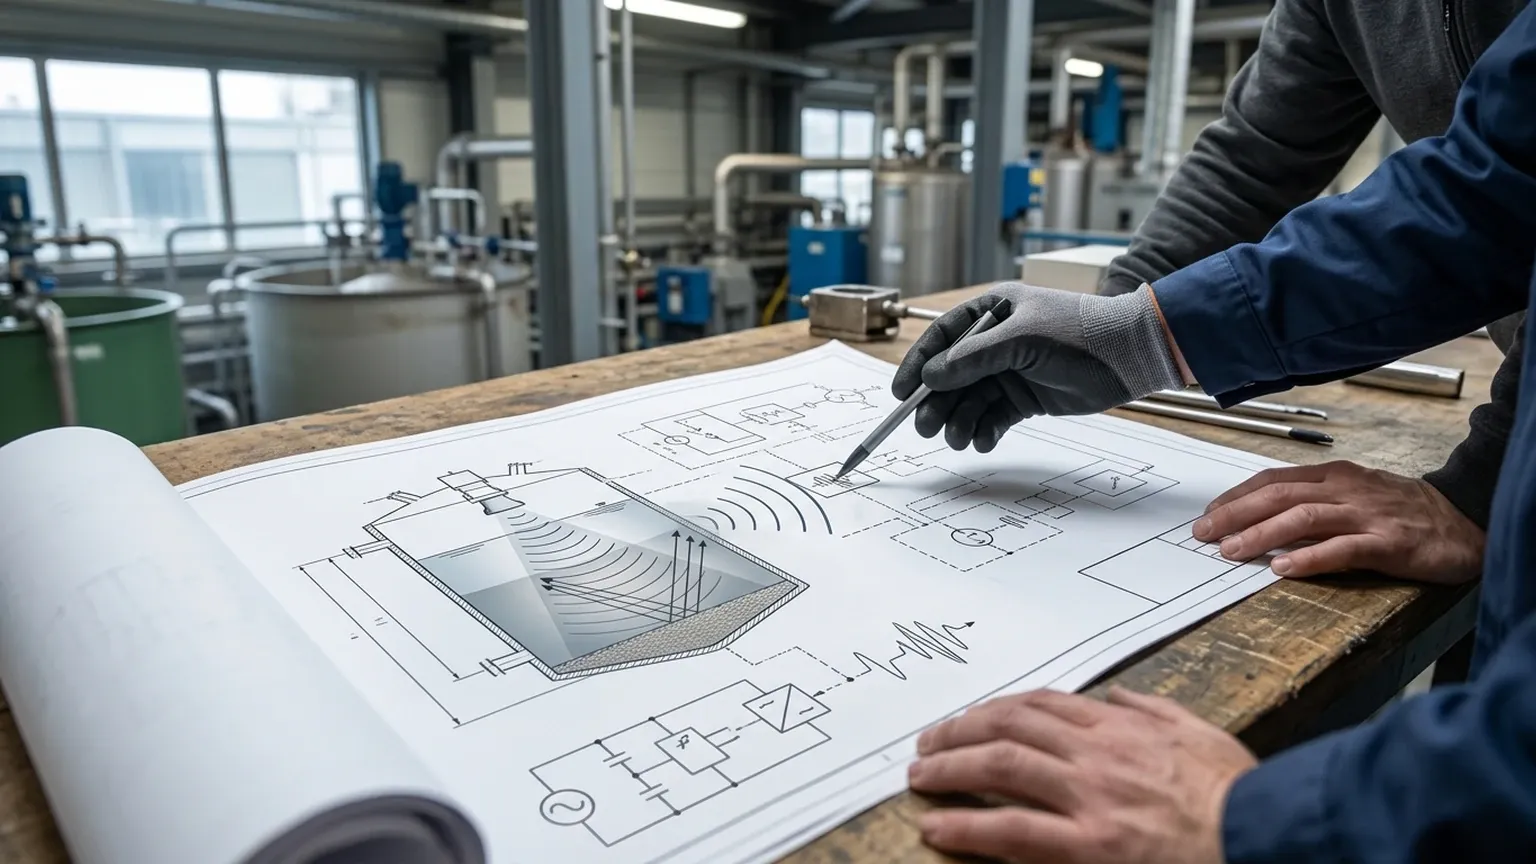
A technical diagram for an ultrasonic sensor generally falls into three categories: the internal block diagram, the wiring (electrical) diagram, and the physical installation/beam geometry diagram. Each serves a specific purpose for the design engineer and the maintenance technician.
1. The Internal Block Diagram
This diagram illustrates the functional components of the device. It typically shows:
* The Transducer: The interface between the electronics and the process.
* Signal Processing Unit: Filters out noise and "false echoes" caused by tank internal structures (agitators, ladders).
* Output Module: Converts the processed signal into a standard industrial output, such as 4-20mA, RS485 (Modbus), or HART protocol.
* Power Management: Regulates the incoming voltage to power the sensitive electronics.
2. The Electrical Wiring Diagram
Wiring is one of the most critical aspects of the ultrasonic level sensor diagram. Most industrial sensors follow one of two configurations:
* Two-Wire (Loop-Powered): In this setup, the 4-20mA signal and the power supply share the same two wires. This is common in standard liquid level applications where power consumption is low.
* Four-Wire (Separately Powered): These units have two wires for the power supply (typically 24V DC or 110/220V AC) and two separate wires for the signal output. This is often required for long-range sensors or devices with integrated displays and high-power transducers.
3. The Physical Installation and Beam Diagram
This diagram illustrates the "Beam Angle" and the "Dead Zone" (also known as the Blocking Distance).
* Beam Angle: The ultrasonic pulse does not travel in a straight line; it spreads out in a conical shape. The diagram will indicate the angle (e.g., 5° to 12°), which is crucial for ensuring the pulse does not hit the tank wall or internal obstructions before reaching the product surface.
* Dead Zone: This is the area immediately below the transducer face where the sensor cannot measure. If the liquid rises into this zone, the sensor will provide an error or an incorrect reading. Typical dead zones range from 0.2m to 0.5m depending on the frequency of the sensor.
Technical Selection Criteria for Ultrasonic Level Meters
Selecting the correct instrument requires matching the application requirements with the sensor's technical specifications. The following table provides a reference for common selection parameters.
| Parameter | Specification Range (Typical) | Considerations |
| :— | :— | :— |
| Measurement Range | 0.3m to 30m | Longer ranges require lower frequencies and larger transducers. |
| Output Signal | 4-20mA, HART, Modbus RS485 | Compatibility with the existing PLC/SCADA system. |
| Operating Temperature | -40°C to +70°C | High temperatures affect the speed of sound and transducer materials. |
| Process Pressure | -0.02 MPa to 0.1 MPa | Ultrasonic sensors are generally for atmospheric or near-atmospheric tanks. |
| Beam Angle | 5° to 12° | Narrower angles are better for tall, narrow tanks or tanks with obstructions. |
| Housing Material | ABS, PVC, PVDF, or Stainless Steel | Must be compatible with the chemical properties of the medium. |
| Accuracy | ±0.25% to ±0.5% of full scale | Higher accuracy models are available for precision inventory control. |
Installation Guidelines and Best Practices
To ensure the performance matches the specifications found in the ultrasonic level sensor diagram, precise installation is mandatory. Engineering teams should follow these guidelines:
1. Perpendicular Alignment: The sensor face must be installed perfectly parallel to the liquid surface. Even a few degrees of tilt can cause the echo to reflect away from the transducer, resulting in signal loss.
2. Avoid the "Center" of Domed Tanks: In tanks with domed or parabolic tops, do not mount the sensor in the exact center. The dome can act as a parabolic reflector, concentrating multiple echoes back to the sensor and causing erratic readings.
3. Distance from the Wall: The sensor should be mounted at a distance from the tank wall to prevent the beam cone from touching the wall. A general rule of thumb is to maintain a distance of at least 200mm for every 1m of depth, though this varies by beam angle.
4. Inflow Protection: Never install the sensor directly above the filling inlet. The turbulence and falling material will interfere with the ultrasonic pulse.
5. Standpipe Usage: If the tank has heavy foam or a very turbulent surface, installing the sensor inside a stilling well or standpipe can provide a calm surface for accurate measurement.
Limitations of Ultrasonic Technology
While highly versatile, Ultrasonic Level Meters are not suitable for every application. Engineers must be aware of the following limitations:
* Vacuum Conditions: Sound waves require a medium (gas) to travel. In a vacuum, ultrasonic sensors cannot function.
* Heavy Dust or Steam: Dense dust (in silos) or heavy steam (in hot water tanks) can absorb or scatter the sound energy, significantly reducing the effective range or causing signal failure.
* Heavy Foam: Some types of foam absorb the ultrasonic pulse entirely, preventing an echo. In these cases, radar level meters are often a better alternative.
* High Pressure/Extreme Temperature: Because the speed of sound is highly dependent on gas density and temperature, extreme fluctuations in pressure and temperature can lead to inaccuracies that exceed the capabilities of standard compensation algorithms.
Frequently Asked Questions (FAQ)
What is the "Dead Zone" in an ultrasonic level sensor diagram?
The dead zone (or blocking distance) is the minimum distance required between the sensor face and the highest liquid level. The sensor cannot process signals within this range because the transducer is still vibrating from the initial pulse when the echo returns.
Can ultrasonic level meters be used for solids?
Yes, but with caveats. Solids like grain, sand, or plastic pellets often form a conical pile rather than a flat surface. This scatters the signal. For solids, it is recommended to use a sensor with a higher power output and a swivel mounting flange to aim the sensor at an angle that maximizes echo return.
How does temperature affect the accuracy?
The speed of sound changes by approximately 0.17% per degree Celsius. Without temperature compensation, a 10°C change could result in a significant measurement error. Most Welk sensors include built-in NTC thermistors to automatically correct for these changes.
What is the difference between an ultrasonic transmitter and an ultrasonic switch?
An ultrasonic level meter (or transmitter) provides a continuous measurement (e.g., 4-20mA) of the level. An ultrasonic switch is a point-level device that only triggers an alert when the material reaches a specific height.
Conclusion
Understanding the ultrasonic level sensor diagram is a fundamental step in ensuring reliable level measurement in industrial environments. By acknowledging the relationship between beam geometry, electrical wiring, and the physical properties of the medium, engineers can avoid common pitfalls and optimize their automation systems. For those seeking robust and cost-effective solutions, exploring the range of Ultrasonic Level Meters provides a pathway to accurate, non-contact monitoring across water treatment, chemical processing, and general manufacturing sectors.