Ultrasonic Level Gauge Diagram
Understanding Ultrasonic Level Meters: A Technical Guide and Diagram Analysis
In the landscape of industrial process control, the ability to accurately monitor liquid and solid levels without physical contact is a significant advantage. Ultrasonic Level Meters have emerged as a primary solution for industries ranging from water treatment to chemical processing. By utilizing high-frequency sound waves, these instruments provide reliable data while minimizing maintenance requirements associated with contact-based sensors.
This article serves as a practical engineering reference for understanding the measurement principles, installation requirements, and technical specifications of these devices, with a specific focus on interpreting an ultrasonic level gauge diagram for successful deployment.
Measurement Principles of Ultrasonic Technology
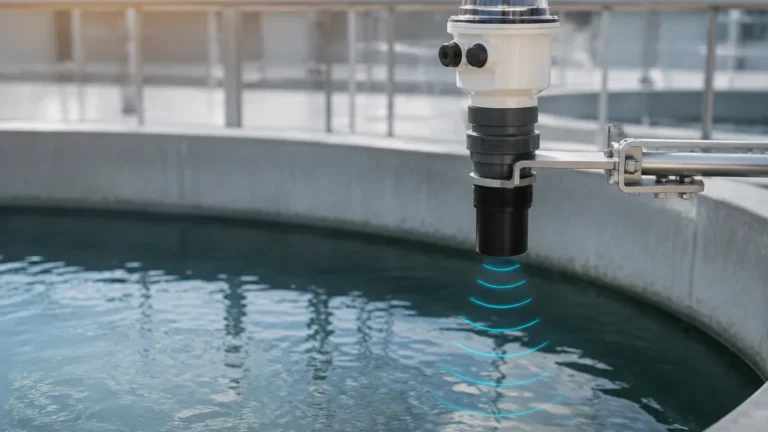
Ultrasonic level measurement is based on the "Time of Flight" (ToF) principle. The instrument’s transducer emits a series of ultrasonic pulses toward the surface of the medium being measured. These sound waves travel through the air, hit the surface of the liquid or solid, and reflect back toward the sensor.
The Mathematical Foundation
The distance between the transducer and the material surface is calculated using the following formula:
D = (c × t) / 2
Where:
* D is the distance to the surface.
* c is the speed of sound in the medium (typically air, approximately 344 m/s at 20°C).
* t is the total time elapsed between the emission of the pulse and the reception of the echo.
Since the total time represents the round trip (down and back), the result is divided by two. The device then subtracts this distance from the total tank height (programmed during calibration) to determine the actual level of the material.
Signal Processing and Echo Filtering
Modern ultrasonic level meters, such as those manufactured by Welk, incorporate advanced digital signal processing (DSP). This allows the instrument to distinguish between the "true echo" from the material surface and "false echoes" generated by internal tank obstructions like ladders, agitators, or weld seams. This capability is critical for maintaining accuracy in complex industrial environments.
Interpreting the Ultrasonic Level Gauge Diagram
A comprehensive ultrasonic level gauge diagram is essential for both the design and installation phases of a project. These diagrams typically illustrate three primary aspects: the physical mounting geometry, the electronic wiring, and the acoustic beam path.
1. The Acoustic Beam Diagram
The diagram illustrates the "beam angle," which is the conical path the sound wave takes as it travels. Most ultrasonic sensors have a beam angle between 5° and 12°. It is vital that no physical obstructions (pipes, brackets, or walls) enter this cone, as they will cause premature reflections and inaccurate readings.
2. The Dead Zone (Blocking Distance)
Every ultrasonic level gauge diagram will highlight a "dead zone" or "blocking distance" immediately below the transducer face. This is an area (typically 0.25m to 0.6m depending on the model) where the sensor cannot process an echo because the transducer is still vibrating from the initial pulse. If the material level enters this zone, the meter will fail to provide a reading or provide an erratic one.
3. Wiring and Connectivity
From an electrical perspective, the diagram defines the connection points for power and signal output. Common configurations include:
* Two-Wire System: The power supply and the 4-20mA output signal share the same pair of wires.
* Four-Wire System: Separate pairs for power (often 24V DC or 110/220V AC) and signal output (4-20mA, RS485/Modbus).
Technical Selection Criteria
Choosing the right ultrasonic level meter requires a thorough evaluation of the application environment. The following table provides a comparison of typical specifications for industrial-grade units.
| Feature | Standard Liquid Application | High-Range / Solid Application |
| :— | :— | :— |
| Measuring Range | 0.4m to 10m | 0.6m to 30m |
| Accuracy | ±0.25% to 0.5% of full scale | ±0.5% of full scale |
| Beam Angle | 8° to 12° | 5° to 8° |
| Output Signal | 4-20mA, HART | 4-20mA, Modbus RS485 |
| Process Temperature | -20°C to +60°C | -40°C to +80°C |
| Enclosure Rating | IP66 / IP67 | IP67 / IP68 |
| Housing Material | ABS / Nylon | Aluminum Alloy / Stainless Steel |
Key Considerations for Selection
1. Measurement Range: Always select a meter with a range at least 20% greater than the actual tank height to account for signal attenuation.
2. Material Type: Liquids provide a clean, flat reflective surface. Solids (like grain or plastic pellets) often have an angle of repose that scatters the signal, requiring more powerful transducers or specialized aiming flanges.
3. Chemical Compatibility: Ensure the transducer face material (e.g., PVDF, PTFE, or PP) is resistant to any corrosive vapors present in the tank.
Installation Guidelines and Best Practices
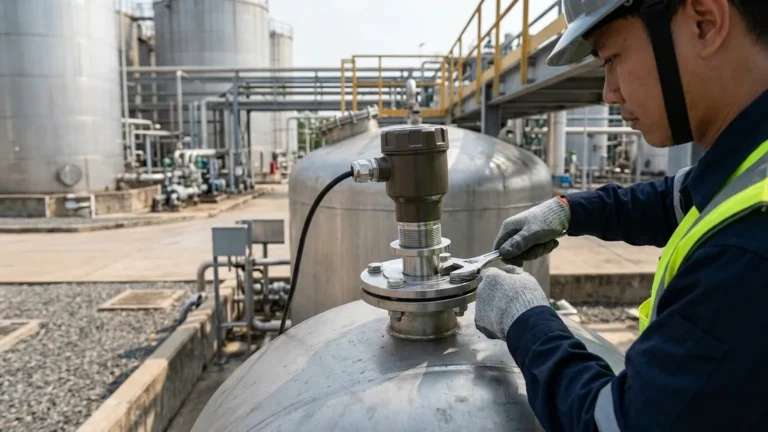
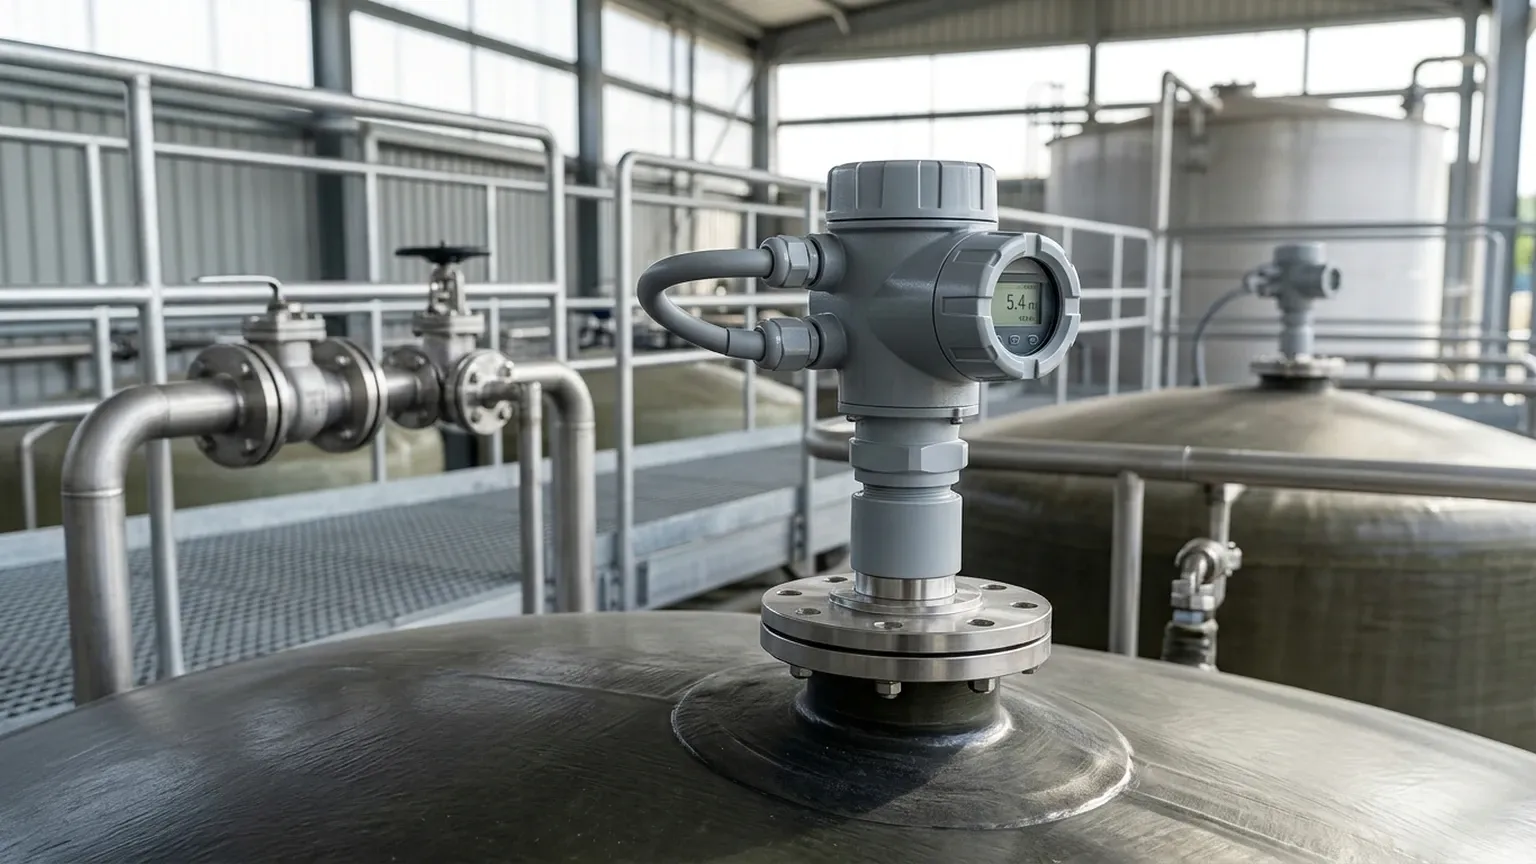
Proper installation is the most significant factor in the performance of Ultrasonic Level Meters. Following the spatial requirements indicated in the ultrasonic level gauge diagram will prevent the majority of common field issues.
Mounting Position
* Avoid the Center: Do not mount the sensor in the exact center of a circular tank, as this can create a "parabolic effect," focusing multiple reflections back to the sensor and causing signal noise.
* The 1/3 Rule: A general rule of thumb is to mount the sensor at a distance of 1/3 the radius from the tank wall.
* Clearance from Walls: Ensure the sensor is at least 200mm to 500mm away from the tank wall to avoid interference from wall rivets or seams.
Orientation
The transducer face must be perfectly parallel to the liquid surface. If the sensor is tilted, the sound wave will reflect away from the transducer rather than back toward it, resulting in a "Loss of Echo" (LOE) error.
Avoiding the Fill Stream
Never install the sensor directly above the inlet pipe or the path of falling material. The turbulence and the physical presence of the incoming stream will obstruct the ultrasonic pulse.
Limitations and Environmental Factors
While highly versatile, ultrasonic technology has physical limitations that engineers must account for during the design phase.
1. Vacuum and Pressure
Sound requires a medium (air or gas) to travel. Therefore, ultrasonic level meters cannot function in a vacuum. High-pressure environments also change the density of the air, which affects the speed of sound. While temperature compensation is standard, pressure compensation is more complex and may require radar technology instead.
2. Heavy Foam and Vapor
Thick, dense foam on the surface of a liquid acts as an acoustic absorber, soaking up the ultrasonic pulse and preventing an echo. Similarly, extremely heavy steam or dust can attenuate the signal. In such cases, a guided wave radar or a high-frequency through-air radar may be more appropriate.
3. Temperature Fluctuations
The speed of sound varies with temperature. Most Welk ultrasonic meters include an integrated temperature sensor to automatically adjust the distance calculation. However, if there is a significant temperature gradient between the sensor and the liquid surface (e.g., a hot liquid in a cold tank), accuracy may be affected.
Frequently Asked Questions (FAQ)
Q: Can ultrasonic level meters be used on solids?
A: Yes, but with caution. Solids like powders or granules scatter the sound signal. It is often necessary to use a sensor with a higher power output and a narrower beam angle. An aiming flange may also be required to point the sensor at the optimal reflection point.
Q: What is the maximum range for an ultrasonic level meter?
A: For liquids, standard industrial units can reach up to 30 meters. However, for most common applications in water treatment and chemical storage, ranges of 5m to 15m are the most frequent.
Q: How do I handle a "Loss of Echo" (LOE) alarm?
A: First, check if the material level is in the dead zone. Second, verify that the transducer face is clean and free of condensation or dust. Third, ensure the sensor is mounted perpendicular to the surface. If these are correct, the issue may be heavy foam or excessive turbulence.
Q: Is it possible to use these sensors in hazardous areas?
A: Yes, many models are available with intrinsically safe (Ex ia) or flameproof (Ex d) ratings for use in explosive atmospheres common in the oil and gas or chemical industries.
Conclusion
Ultrasonic level meters provide a cost-effective, non-contact solution for a wide variety of industrial level monitoring needs. By carefully studying the ultrasonic level gauge diagram and adhering to strict installation protocols, engineers can ensure high accuracy and long-term reliability. Whether managing water levels in a municipal plant or monitoring chemical stocks, understanding the relationship between the acoustic beam, the dead zone, and the environment is the key to successful implementation.
For specific application support or to explore detailed product specifications, project managers should Review product options and application support to ensure the selected instrumentation aligns with their operational requirements.