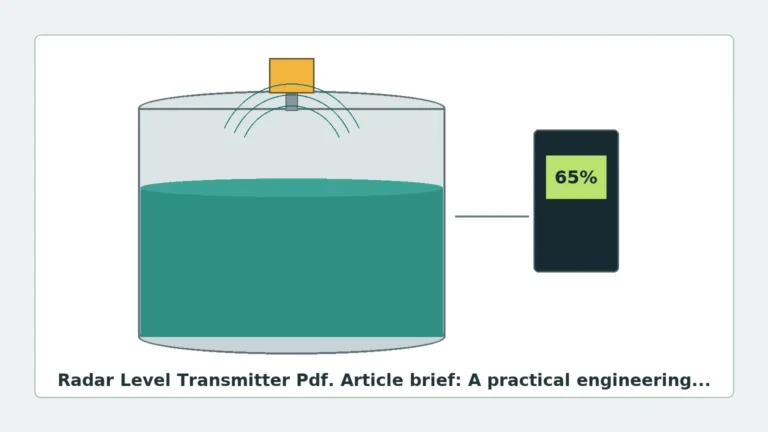
Radar Level Transmitter Diagram
Radar Level Transmitter Diagram: An Engineering Guide to Non-Contact Measurement
In the landscape of industrial automation, the ability to accurately monitor liquid and solid levels in harsh environments is critical for process safety and efficiency. Among the various technologies available, radar level measurement has emerged as a gold standard due to its non-contact nature and relative immunity to changes in pressure, temperature, and vapor space composition. Understanding a radar level transmitter diagram—whether it represents the internal circuitry, the wiring loop, or the physical installation geometry—is essential for instrumentation engineers and procurement specialists tasked with implementing these systems.
As a professional manufacturer, Welk provides high-performance Radar Level Meters designed to meet the rigors of chemical processing, water treatment, and oil and gas applications. This guide explores the technical principles, selection criteria, and installation requirements necessary to successfully integrate radar technology into your facility.
1. Principles of Radar Level Measurement
Before analyzing a specific radar level transmitter diagram, it is important to understand the two primary methods used to calculate distance: Pulse Radar and Frequency Modulated Continuous Wave (FMCW).
Pulse Radar (Time of Flight)
Pulse radar transmitters emit a short microwave signal toward the product surface. The signal travels at the speed of light, reflects off the material, and returns to the sensor antenna. The instrument measures the "Time of Flight" (ToF). Since the speed of light is constant, the distance is calculated as:
Distance = (Speed of Light × Travel Time) / 2
Pulse radar is often preferred for its lower power consumption, making it ideal for battery-powered or two-wire loop-powered applications.
FMCW (Frequency Modulated Continuous Wave)
FMCW radar transmits a continuous signal with a constantly changing frequency (a frequency sweep). When the reflected signal is received, it is compared to the signal being transmitted at that exact moment. The difference in frequency (the "beat frequency") is directly proportional to the distance. FMCW is generally more accurate than pulse radar and offers a better signal-to-noise ratio, making it the preferred choice for complex tanks with internal obstructions or turbulent surfaces.
2. Deciphering the Radar Level Transmitter Diagram
In technical documentation, a radar level transmitter diagram typically falls into three categories: functional block diagrams, wiring diagrams, and installation geometry diagrams.
2.1 Functional Block Diagram
This diagram illustrates the internal logic of the device. It typically includes:
* The Oscillator/Signal Generator: Creates the high-frequency microwave signal.
* The Antenna: Acts as the transducer, converting electrical energy into electromagnetic waves and vice versa.
* The Signal Processor (DSP): The "brain" of the unit that filters out noise (false echoes) and calculates the level.
* The Output Stage: Converts the digital calculation into a 4-20mA signal, HART, Modbus, or Profibus output.
2.2 Wiring Diagram
For the field technician, the wiring diagram is the most critical. It defines how the unit receives power and transmits data.
* 2-Wire Configuration: The power and the 4-20mA signal share the same pair of wires. This is common in standard industrial loops.
* 4-Wire Configuration: Separate pairs for power supply (often 24V DC or 110/230V AC) and signal output. This is used for high-power units, such as those with integrated heaters or high-gain FMCW processors.
2.3 Installation Geometry Diagram
This diagram defines the physical constraints of the measurement. It highlights the Beam Angle, the Dead Zone (or Blocking Distance), and the Nozzle Dimensions. Understanding this diagram prevents common errors such as mounting the sensor too close to a tank wall, which causes parasitic reflections.
3. Technical Selection Criteria
Choosing the right radar level meter requires balancing frequency, antenna design, and process conditions. The following table provides a comparison of common radar configurations.
Radar Selection Reference Table
| Feature | 6 GHz Radar | 26 GHz Radar | 80 GHz Radar |
| :— | :— | :— | :— |
| Beam Angle | Wide (approx. 20-30°) | Medium (approx. 8-12°) | Narrow (approx. 3-4°) |
| Accuracy | ±10 mm to ±20 mm | ±2 mm to ±5 mm | ±1 mm |
| Best Use Case | Heavy steam, foam, or turbulence | Standard process tanks, oils | Small tanks, narrow nozzles, solids |
| Antenna Size | Large (Horn/Rod) | Medium (Horn/Lens) | Small (Lens/Flush) |
| Penetration | High (through foam/vapor) | Moderate | Low (affected by heavy foam) |
4. Installation Considerations and Best Practices
To ensure the accuracy depicted in a radar level transmitter diagram translates to real-world performance, engineers must adhere to strict installation guidelines.
The 1/6 Rule
As a general rule of thumb, the transmitter should be installed at a distance of 1/6th of the tank diameter from the tank wall. Mounting too close to the center can lead to multiple-path reflections (bouncing off the bottom and back), while mounting too close to the wall causes signal interference from the tank shell.
Avoiding Obstructions
The radar beam is cone-shaped. Any internal hardware—such as cooling coils, ladders, or agitators—that enters this cone will create a "false echo." Modern signal processing allows for "False Echo Suppression," where the software learns to ignore these static reflections, but it is always better to avoid them during the design phase.
Nozzle Height and Diameter
The mounting nozzle should be as short as possible. If the nozzle is too long or narrow, the radar signal will reflect off the inside of the nozzle itself, creating a large interference signal near the top of the tank (the "ringing" effect). For 80 GHz units, flush-mount antennas are often used to eliminate this issue entirely.

5. Limitations and Application Risks
While radar is highly versatile, it is not a "one-size-fits-all" solution. Engineers must be aware of the following limitations:
1. Dielectric Constant (εr): Radar relies on a change in the dielectric constant at the surface of the material. Materials with a very low dielectric constant (like liquid nitrogen or certain dry powders) reflect very little energy. In these cases, a Guided Wave Radar (GWR) or a high-sensitivity FMCW unit is required.
2. Heavy Foam: While low-frequency radar (6 GHz) can penetrate some foam, thick, dense foam can absorb the radar signal entirely, leading to a loss of echo.
3. Vacuum and Pressure: While the vacuum itself does not affect the speed of the radar wave, the mechanical seals of the transmitter must be rated for the specific process pressure and temperature.
6. Maintenance and Troubleshooting
Radar transmitters are solid-state devices with no moving parts, meaning maintenance is minimal. However, in applications with heavy coating or condensation, the antenna may require periodic cleaning.
Common Troubleshooting Steps:
* Loss of Echo: Check for heavy buildup on the antenna or a significant change in the material's dielectric constant.
* Fixed Reading: This often indicates the transmitter is locked onto a false echo from an internal obstruction. Re-run the "False Echo Mapping" or "Empty Tank Spectrum" scan.
* Fluctuating Readings: Usually caused by surface turbulence. Increasing the damping (integration time) in the software can stabilize the output.
7. Frequently Asked Questions (FAQ)
Q: Can radar measure level through a plastic tank wall?
A: Yes. Because plastic is non-conductive and has a low dielectric constant, microwaves can pass through it. This allows for non-invasive measurement from outside a plastic IBC or storage tank.
Q: What is the difference between "Non-Contact Radar" and "Guided Wave Radar"?
A: Non-contact radar sends waves through the air. Guided Wave Radar (GWR) sends the pulse down a physical probe (cable or rod). GWR is better for low-dielectric liquids and applications with heavy foam or bypass chambers.
Q: How does frequency affect the radar level transmitter diagram?
A: Higher frequencies (like 80 GHz) allow for smaller antennas and narrower beam angles. This simplifies the installation diagram because the "clearance zone" required to avoid obstructions is much smaller.
Q: Is a radar level transmitter affected by dust?
A: In most cases, no. Unlike ultrasonic sensors, radar is not affected by air density or dust particles. However, extremely high concentrations of dust in grain silos may require a high-power 26 GHz or 80 GHz transmitter with a dust-purging connection.
Conclusion
Understanding the nuances of a radar level transmitter diagram is the first step toward achieving reliable process control. By selecting the correct frequency and antenna type, and following rigorous installation standards, industrial operators can significantly reduce downtime and improve measurement accuracy.
For technical specifications and assistance in selecting the right instrumentation for your specific application, you can Review product options and application support from Welk’s engineering team. Whether you are dealing with corrosive chemicals, high-temperature bitumen, or simple water storage, our range of radar level meters provides the precision and durability required for modern industrial environments.