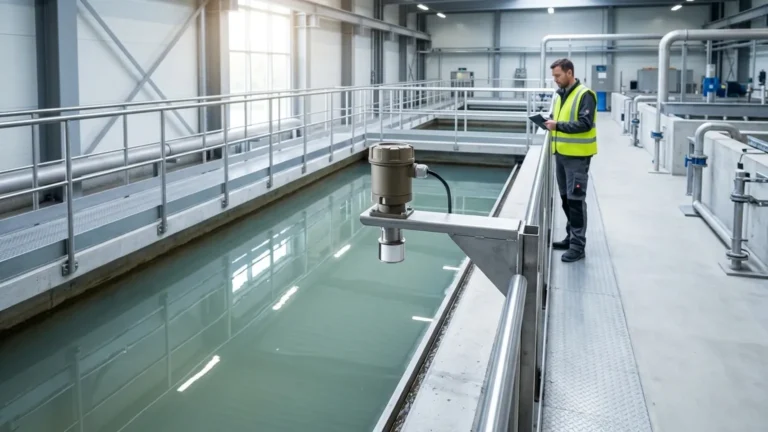
Ultrasonic Level Sensor Images
Ultrasonic Level Sensor Images: A Practical Engineering Guide to Visual Selection and Installation
In the field of industrial automation, selecting the correct instrumentation requires more than just reviewing a datasheet. For process engineers and system integrators, analyzing ultrasonic level sensor images, technical drawings, and beam pattern diagrams is a critical step in ensuring hardware compatibility with specific tank geometries and environmental conditions. Visual documentation provides essential context regarding mounting requirements, housing robustness, and the physical footprint of the device within a control system.
Ultrasonic Level Meters are non-contact instruments used extensively for measuring the level of liquids and certain solid materials. By understanding both the physical characteristics shown in product images and the underlying physics of the measurement, engineers can avoid common installation errors and optimize the reliability of their level monitoring systems.
Fundamental Principles of Ultrasonic Level Measurement
Before evaluating hardware through ultrasonic level sensor images, it is vital to understand the operational physics. Ultrasonic sensors operate on the Time-of-Flight (ToF) principle. The device contains a piezoelectric transducer that emits high-frequency sound pulses, typically in the range of 20 kHz to 200 kHz.
The Time-of-Flight (ToF) Equation
Once the pulse is emitted, it travels through the air space in the vessel, hits the surface of the medium, and reflects back to the sensor. The sensor then switches to "receiving mode" to detect the returning echo. The distance (D) is calculated using the following formula:
D = (c × t) / 2
Where:
* c is the speed of sound in the medium (approximately 344 m/s or 1,128 ft/s in air at 20°C).
* t is the elapsed time between emission and reception.
Because the speed of sound is influenced by air temperature (increasing by approximately 0.6 m/s per degree Celsius), professional-grade ultrasonic level meters include integrated temperature sensors to provide real-time compensation, ensuring accuracy remains within ±0.25% to ±0.5% of the measured range.
Analyzing Ultrasonic Level Sensor Images for Hardware Design
When reviewing ultrasonic level sensor images, engineers should look for specific physical attributes that indicate the sensor's suitability for their application. Visual inspection of the hardware reveals several key design elements:
1. Housing Material and Ingress Protection
Images of the sensor body often show the material construction. For corrosive environments, such as acid storage tanks, engineers look for all-plastic constructions (typically PVDF or Polypropylene). In contrast, industrial automation in wastewater often utilizes rugged ABS or aluminum housings. The sealing of the cable entry and the display window provides a visual cue to the IP (Ingress Protection) rating, usually IP65, IP67, or IP68 for submersible versions.
2. Transducer Face Design
The "face" of the sensor is the most critical component. Images reveal whether the transducer is exposed or covered by a protective diaphragm. A smooth, flat face is easier to clean and less likely to accumulate condensation or material buildup, which can interfere with signal transmission.
3. Integrated vs. Split Type Configurations
Visual documentation helps distinguish between integrated (all-in-one) units and split-type (remote) units. Integrated units house the transducer and the electronics in a single head, which is ideal for simple installations. Split-type units, as seen in many ultrasonic level sensor images, separate the sensor probe from the controller/display. This is preferred when the measurement point is in a hazardous or inaccessible area, allowing the operator to read the level from a safe distance.
Key Selection Criteria and Technical Specifications
Choosing the right ultrasonic instrument requires balancing the physical constraints shown in images with the technical requirements of the process. The following table provides a reference for common selection parameters.
Selection Reference Table
| Parameter | Standard Industrial Range | High-Performance Range | Considerations |
| :— | :— | :— | :— |
| Measurement Range | 0.3m to 10m (1ft to 33ft) | Up to 30m or 40m (131ft) | Longer ranges require lower frequencies. |
| Blind Zone | 0.2m to 0.5m (8" to 20") | < 0.2m (8") | The area directly below the sensor where measurement is impossible. |
| Output Signal | 4-20mA, RS485 (Modbus) | HART, Profibus, GPRS | Compatibility with existing PLC/SCADA systems. |
| Beam Angle | 8° to 12° | 5° to 6° | Narrower angles are better for narrow tanks or internal obstructions. |
| Operating Temp | -20°C to +60°C | -40°C to +95°C | High temperatures affect sound speed and sensor durability. |
| Power Supply | 24V DC | 220V AC / Battery | 2-wire vs. 4-wire wiring configurations. |
Installation Diagrams and Visual Placement Guidelines
Proper installation is the single most important factor in the success of an ultrasonic level system. Engineers must use ultrasonic level sensor images and installation diagrams to plan the mounting location relative to the vessel's internal features.
Avoiding the "Dead Zone"
Every ultrasonic sensor has a "dead zone" or "blocking distance" directly beneath the transducer. In this zone, the sensor cannot switch from emitting to receiving fast enough to capture the echo. If the liquid level enters this zone, the sensor will report an error or an incorrect maximum reading. Installation images usually show the sensor mounted on a stand-off pipe or nozzle to ensure the maximum liquid level remains below the dead zone.
Beam Spread and Obstructions
The ultrasonic pulse does not travel in a straight line; it spreads out in a cone. If the cone touches the side of a tank wall or an internal ladder, it will create a "false echo."
* The Rule of Thumb: For every 1 meter of depth, the beam spreads by approximately 10-15cm (depending on the beam angle).
* Placement: The sensor should be mounted at least 20cm (8 inches) away from the tank wall and away from the inflow stream to avoid turbulence and noise.
Perpendicularity
The transducer face must be mounted perfectly parallel to the liquid surface. If the sensor is tilted, the sound wave will reflect off the surface at an angle and may not return to the transducer, resulting in a "Loss of Echo" (LOE) alarm.

Limitations and Operational Boundaries
While ultrasonic sensors are versatile, they are not universal solutions. Certain process conditions can degrade the acoustic signal, making measurement unreliable. Understanding these limitations is as important as reviewing ultrasonic level sensor images for fitment.
1. Vacuum Conditions: Sound waves require a medium (air or gas) to travel. In a vacuum, ultrasonic sensors cannot function.
2. Heavy Foam: Thick, dense foam on the surface of a liquid absorbs the sound pulse rather than reflecting it. In these cases, a radar level meter or a contact-based solution like a magnetic level gauge may be required.
3. Vapor and Dust: Heavy steam or high concentrations of dust can scatter the ultrasonic signal. While some high-power sensors can penetrate light dust, extreme conditions will result in signal attenuation.
4. High Pressure: Changes in pressure alter the density of the air, which in turn affects the speed of sound. While many sensors can handle moderate pressure, they are generally not suited for high-pressure reactor vessels.
Frequently Asked Questions (FAQs)
Why does my sensor show a full tank when it is actually empty?
This is often caused by a false echo from an internal obstruction (like a pipe or a weld seam) or condensation on the transducer face. Checking the installation against ultrasonic level sensor images of correct mounting can help identify if the beam is hitting an object. Most modern sensors allow for "False Echo Suppression," where the software is taught to ignore specific static reflections.
Can I use an ultrasonic sensor to measure solids like grain or sand?
Yes, but with caveats. Solid materials do not have a flat surface; they form cones and have irregular textures that scatter sound. For solids, it is recommended to use a sensor with a higher power output and a lower frequency to ensure a strong enough return signal.
What is the difference between 2-wire and 4-wire sensors in product images?
In ultrasonic level sensor images, a 2-wire sensor typically has a single cable entry because the power and the 4-20mA signal share the same pair of wires. A 4-wire sensor often has a larger housing or dual cable entries to accommodate separate power (e.g., 220V AC) and signal wires.
How do I maintain the sensor?
Ultrasonic sensors are generally low-maintenance because they have no moving parts. However, the transducer face should be periodically inspected for buildup. If the sensor is used in a humid environment, ensuring the cable gland is tight and the housing is sealed is essential to prevent moisture ingress.
Conclusion
Visualizing the application through ultrasonic level sensor images and technical diagrams is a foundational step in industrial level measurement. By combining a clear understanding of the Time-of-Flight principle with rigorous attention to installation geometry and environmental limitations, engineers can deploy Ultrasonic Level Meters that provide years of accurate, maintenance-free service. Whether monitoring water levels in a treatment plant or chemical volumes in a processing facility, the right visual and technical preparation ensures the integrity of the entire automation loop.